Belo Horizonte, Brazil and Singapore, August 13, 2026 – Verde AgriTech Ltd (TSX: NPK | OTCQX: VNPKF) (“Verde” or the “Company”) today reported its financial and operating results for the three and six months ended June 30, 2026 (“Q2 2026”).
“Q2 2026 was marked by greater selectivity in fertilizer purchasing across Brazilian agriculture. The underlying need for crop nutrition remained, but fertilizer affordability, restrictive financing and the expected return on each application increasingly shaped the timing and scope of purchasing decisions. In this environment, our focus is to understand customer priorities more precisely, direct our efforts toward the most relevant opportunities and shorten the path from technical validation to commercial adoption,” stated Reberth Machado, Chief Executive Officer of Verde.
“Closer customer engagement is central to that approach. Since becoming CEO, my priority has been to engage directly with Verde’s major clients, strategic B2B customers, and well-renowned agronomic advisers across Brazil. We are also seeking a stronger presence at major industry events, particularly in Sugarcane, where I bring extensive operating experience and longstanding relationships, and in composting-related segments, where our products have synergistic fit. These discussions are sharpening how we prioritize accounts, deploy commercial resources, and develop new business, with clear criteria for pricing, credit and resource allocation,” Mr. Machado added.
Second Quarter 2026 Financial Highlights
All figures are in Canadian dollars unless otherwise stated.
- Revenue in Q2 2026 was $3.4 million compared with $4.8 million in Q2 2025 and sales volume totaled 46,709 tons in Q2 2026 compared with 80,354 tons in Q2 2025. Excluding product delivery freight revenue, average revenue per ton increased to $40 from $38.
- Unit profitability remained resilient, with average gross profit per ton, excluding product delivery freight revenue, increasing to $23 from $22 in Q2 2025, even in a lower-volume environment.
- Sales and marketing and general and administrative expenses decreased by 10% in Q2 2026 compared with Q2 2025.
- EBITDA before non-cash events was $(1.2) million in Q2 2026 compared with $(0.2) million in Q2 2025.
- Net loss was $(3.6) million in Q2 2026 compared with a net loss of $(2.4) million in Q2 2025.
- As of June 30, 2026, the Company held $4.1 million in cash and $5.7 million in short-term receivables, compared with $2.4 million and $8.2 million, respectively, as of June 30, 2025.
Q2 2026 Sustainability Results
In Q2 2026, products sold by Verde had the potential to capture up to 5,605 tons of CO₂ through Enhanced Rock Weathering, with estimated net carbon removal of 3,937 tons, while also avoiding an estimated 2,336 tons of CO₂e emissions by replacing potassium chloride fertilizers. Since production began in 2018, the combined potential net carbon removal and avoided emissions total approximately 348,790 tons of CO₂. Additionally, 3,698 tons of chloride were prevented from entering soils in Q2 2026, bringing the cumulative total avoided since inception to approximately 198,132 tons.
Magnes Rare Earths and Minas Americas Highlights
During Q2 2026, Verde established Magnes Rare Earths as a wholly owned platform dedicated to advancing the Minas Americas Global Alliance project, preserving Verde shareholders’ exposure while providing focused technical and capital markets leadership. On June 16, Magnes reported assays from 253 additional drill holes, bringing the total reported to 297. The update included 10.0 metres from surface at 0.97% TREO and reinforced the repetition of shallow mineralization with an NdPr-led magnet rare earth basket and Dy/Tb support[1].
Magnes is integrating the expanded dataset into geological modelling and metallurgical testwork. Subject to technical, financing and regulatory conditions, it is targeting maiden S-K 1300 and NI 43-101 mineral resource estimates before year-end 2026 and a preliminary economic assessment in H1 2027. Magnes also intends to pursue a future U.S. stock exchange listing, subject to applicable approvals and market conditions. The assays are head grades and do not represent recoverable grades, mineral resources, mineral reserves or project economics. Leonardo Deringer Fraga, P.Geo., an independent Qualified Person under NI 43-101, has reviewed and approved the scientific and technical information in this release (EGBC Licence No. 61611).
Brazil’s rare earth policy backdrop also became more constructive. In June, the Ministry of Mines and Energy published a study supporting the preparation of a National Rare Earths Strategy.[2] In July, the Ministry approved the National Mining Plan 2050 through Portaria MME No. 924/2026.[3] The Chamber of Deputies also approved Bill 2,780/2024, which would establish a national policy for critical and strategic minerals, and sent it to the Federal Senate for consideration.[4]
Fertilizer Market Conditions
Brazil’s agricultural input market remained under significant financial pressure in Q2 2026. The principal constraint was access to credit and working capital, which led growers, distributors and cooperatives to preserve cash, reduce commitments, and defer fertilizer purchases.
The Central Bank of Brazil reduced the Selic rate to 14.25% in June and further to 14.00% after quarter-end in August. Financing costs nevertheless remained elevated throughout Q2, and the easing implemented during the quarter had not yet translated into a broad improvement in credit availability by quarter-end.[5]
Sector credit quality also deteriorated. At the end of June 2026, a record 1,263 Brazilian agricultural businesses were in judicial reorganization, 66% more than at the end of June 2025. This increase reflected persistent financial stress across the sector, as growers, distributors and other participants across the agricultural value chain continued to face constrained liquidity, high financing costs and weaker cash generation.[6]
The pressure was visible in the 2026/27 fertilizer buying cycle. By late May, Brazilian soybean growers had secured approximately 50% of expected fertilizer requirements, compared with more than 60% historically.[7] Customers shortened buying windows and, in some cases, reducing purchases, limiting visibility over the timing and conversion of demand.
The 2026 election year added a further planning variable. As the October presidential election approached, uncertainty over the post-election fiscal and interest-rate outlook remained in focus, while El Niño forecasts increased the risk of regional changes in planting and nutrient-application windows.[8] Together, restricted credit, elevated sector insolvencies and political and climate uncertainty kept commercial conditions difficult throughout the quarter. For Verde, these conditions required continued discipline in credit approval, pricing and account selection.
Q2 2026 FINANCIAL RESULTS
The following table provides information about the three and six months ended June 30, 2026, compared with the three and six months ended June 30, 2025.
| All amounts in CAD $’000, except per-ton data and percentages |
3 months ended
June 30, 2026 |
3 months ended
June 30, 2025 |
6 months ended
June 30, 2026 |
6 months ended
June 30, 2025 |
| Tons sold (‘000) |
47 |
80 |
74 |
128 |
| Average revenue per ton sold $ |
73 |
60 |
69 |
60 |
| Average production cost per ton sold $ |
(17) |
(16) |
(20) |
(16) |
| Average gross profit per ton sold $ |
56 |
44 |
49 |
44 |
| Average gross margin |
77% |
73% |
71% |
73% |
| |
|
|
|
|
| Revenue |
3,425 |
4,800 |
5,102 |
7,652 |
| Production costs |
(816) |
(1,316) |
(1,458) |
(2,073) |
| Gross Profit |
2,609 |
3,484 |
3,644 |
5,579 |
| Gross Margin |
77% |
73% |
71% |
73% |
| Sales and marketing expenses |
(751) |
(891) |
(1,478) |
(1,742) |
| Product delivery freight expenses |
(1,559) |
(1,733) |
(2,184) |
(2,848) |
| General and administrative expenses |
(1,003) |
(1,048) |
(2,036) |
(2,098) |
| Allowance for expected credit losses |
(518) |
6 |
(542) |
(507) |
| EBITDA (1) |
(1,222) |
(182) |
(2,596) |
(1,616) |
| Share-Based, Equity and Bonus Payments (Non-Cash Event) (2) |
(34) |
(72) |
(102) |
(233) |
| Depreciation and Amortization (3) |
(862) |
(772) |
(1,684) |
(1,546) |
| Operating (Loss) / Profit after non-cash events |
(2,118) |
(1,026) |
(4,382) |
(3,395) |
| Interest Income/Expense |
(1,514) |
(1,394) |
(2,978) |
(2,802) |
| Net (Loss) / Profit before tax |
(3,632) |
(2,420) |
(7,360) |
(6,197) |
| Income tax |
(5) |
(6) |
(6) |
(10) |
| Net (Loss) / Profit |
(3,637) |
(2,426) |
(7,366) |
(6,207) |
(1) Non-GAAP measure. EBITDA before non-cash events is calculated as operating loss before depreciation, amortization and non-cash events. Refer to the section entitled “Non-GAAP and Other Financial Measures” below.
(2) Included within General and Administrative expenses in the financial statements.
(3) Included within General and Administrative expenses and Cost of Sales in the financial statements.
Sales Performance
Revenue for Q2 2026 was $3.4 million compared with $4.8 million in Q2 2025. The decline reflected lower volume as customers shortened buying windows and, in some cases, reassessed planting expansion and planned nutrient applications in response to tighter liquidity and weaker crop economics. Verde continued to apply selective credit criteria, particularly for specialty fertilizer sales that include third-party raw materials and did not extend higher-risk terms without adequate compensation.
Looking beyond the current buying cycle, tighter global grain balances could provide a more constructive backdrop for grower economics. Reuters reported that global wheat and corn output for 2026/27 is projected to fall short of consumption, reducing the supply cushion.[9] If this supports firmer crop prices and stronger grower cash generation, management believes fertilizer purchasing capacity and Verde’s order conversion could begin to improve during H1 2027[10].
Gross profit
Gross profit was $2.6 million in Q2 2026 compared with $3.5 million in Q2 2025, reflected by lower sales volume. Excluding product delivery freight revenue, average revenue per ton was $40 compared with $38, while average production cost per ton was $17 compared with $16. Despite the lower sales volume and the fixed nature of a significant portion of production costs, the Company maintained unit profitability broadly in line with the prior year, with average gross profit per ton of $23 compared with $22 and gross margin of 57% compared with 58%.
Sales, general and administrative expenses
Sales, general and administrative expenses decreased by 10% to $1.75 million in Q2 2026, compared with $1.94 million in Q2 2025. These reductions are related to supplier contract reviews, contract renegotiations, workforce reductions, and tighter discretionary-spend controls, showing that proactive actions were taken, given the current market conditions.
Allowance for expected credit losses
The Company recognized an expected credit loss expense of $0.5 million in Q2 2026, compared with a nominal recovery in Q2 2025. The charge primarily related to trade receivables from a customer that entered judicial reorganization in Brazil during the quarter.
Financial Results and Profitability
EBITDA before non-cash events for Q2 2026 was $(1.2) million compared with $(0.2) million in Q2 2025. Lower gross profit and the expected credit loss charge were partly offset by lower sales and marketing, freight and administrative expenses.
Net loss for Q2 2026 was $(3.6) million compared with $(2.4) million in Q2 2025. Net finance expense was $(1.5) million compared with $(1.4) million, reflecting the continued effect of elevated interest rates.
Basic and diluted loss per share was $(0.064) in Q2 2026 compared with $(0.046) in Q2 2025.
Liquidity, Debt and Working Capital
As of June 30, 2026, the Company held $4.1 million in cash and $5.7 million in short-term receivables. Total loan balance was $55.1 million, of which $6.8 million was due within 12 months and $48.3 million was due thereafter, with an average interest rate of 16.25% per annum.
The Company ended Q2 2026 with working capital of $1.7 million. Current liabilities were $10.0 million compared with $3.5 million as of June 30, 2025, primarily reflecting the reclassification of borrowings into current liabilities as repayments became due. The applicable repayment terms are under renegotiation.
Q2 2026 Financial Results Conference Call
The Company will host a conference call to discuss Q2 2026 results and provide an update. Subscribe using the link below and receive the conference details by email.
The Company’s financial statements and related notes for the period ended June 30, 2026, are available to the public on SEDAR+ at www.sedarplus.ca and the Company’s website at www.investor.verde.ag/.
About Verde AgriTech
Verde AgriTech is a Brazil‑focused specialty fertilizer company listed on the TSX and OTCQX. Through its wholly owned subsidiary Magnes Rare Earths, the Company also retains exposure to the Minas Americas Global Alliance rare earth project in Minas Gerais, Brazil. For more information on how we are leading the way towards sustainable agriculture and climate change mitigation in Brazil, visit our website at https://verde.ag/en/home/.
For additional information please contact:
Investor Relations
Tel: +55 (31) 3245 0205; Email: investor@verde.ag
www.verde.ag | www.investor.verde.ag
Non-GAAP and Other Financial Measures
Earnings before interest, taxes, depreciation and amortization (“EBITDA”) is not a generally accepted measure of financial performance under IFRS. Management of the Company utilizes EBITDA as a financial performance measure to assess profitability and return on equity in its decision-making. In addition, the Company, its lenders and investors use EBITDA to measure performance and value for various purposes. Investors are cautioned, however, that EBITDA should not be construed as an alternative to net loss attributable to common shareholders determined in accordance with IFRS as an indicator of the Company’s performance.
The Company’s method of calculating EBITDA may differ from other companies and, accordingly, they may not be comparable to similarly named measures used by other companies. A quantitative reconciliation of EBITDA is included below.
| Adjusted EBITDA Reconciliation |
3 months ended
June 30, 2026 |
3 months ended
June 30, 2025 |
6 months ended
June 30, 2026 |
6 months ended
June 30, 2025 |
| Net loss |
(3,637) |
(2,426) |
(7,366) |
(6,207) |
| Add (Deduct): |
|
|
|
|
| Interest Income/Expense |
1,514 |
1,394 |
2,978 |
2,802 |
| Income tax |
5 |
6 |
6 |
10 |
| Share-Based, Equity and Bonus Payments (Non-Cash Event) |
34 |
72 |
102 |
233 |
| Depreciation and Amortization |
862 |
772 |
1,684 |
1,546 |
| Adjusted EBITDA |
(1,222) |
(182) |
(2,596) |
(1,616) |
|
|
|
|
|
|
(1) Refer to “Non-GAAP and Other Financial Measures” section of MD&A for discussion of non-IFRS measures used in this table.
Cautionary Language Regarding Forward-Looking Statements and Other Advisories
Forward-Looking Information and Forward-Looking Statements
This news release contains “forward-looking information” within the meaning of applicable Canadian securities laws and “forward-looking statements” within the meaning of the United States Private Securities Litigation Reform Act of 1995 (collectively, “forward-looking statements”). Forward-looking statements are made as of the date of this news release and relate to future events or performance. Often, but not always, forward-looking statements can be identified by words such as “expects,” “anticipates,” “plans,” “projects,” “estimates,” “envisages,” “assumes,” “intends,” “strategy,” “goals,” “objectives,” or variations (including negative variations) of such words and phrases, or statements that certain actions, events or results “may,” “could,” “would,” “might,” or “will” be taken, occur or be achieved.
Forward-looking statements in this news release include, without limitation, statements regarding: (i) the potential amount and timing of carbon removal and avoided emissions associated with Verde’s products; (ii) the customer-led commercial strategy under Reberth Machado, including customer engagement, account prioritization and conversion; (iii) Magnes Rare Earths, continued drilling, geological modelling, metallurgical testwork, the potential timing and publication of S-K 1300 and NI 43-101 mineral resource estimates, a preliminary economic assessment and a possible future U.S. stock exchange listing; (iv) agricultural credit conditions, fertilizer affordability, demand and Verde’s competitive position; and (v) the liquidity-preservation and creditor-engagement strategy, including payment suspensions and efforts to obtain waivers, standstill arrangements, amendments, extensions or other revised terms.
These forward-looking statements are based on management’s current expectations, estimates and assumptions as of the date hereof, including, without limitation: customer demand and purchasing behavior; the availability and cost of agricultural credit; the effectiveness of commercial initiatives; the presence and continuity of mineralization; the representativeness of assay results; the availability of equipment, laboratories, personnel and financing; metallurgical performance; receipt of required corporate, regulatory, exchange and shareholder approvals; foreign exchange rates; realized selling prices; market adoption of Verde’s products; and the Company’s ability to negotiate sustainable terms with creditors.
Forward-looking statements are inherently subject to known and unknown risks, uncertainties and other factors that may cause actual results to differ materially from those expressed or implied. These include, without limitation: agricultural credit constraints; grower, distributor or cooperative insolvencies; customer concentration and collection risk; failure to execute the customer-led commercial strategy; leadership-transition and key-person risks; lower-than-expected demand, prices, margins or cash conversion; foreign-exchange and interest-rate volatility; debt defaults, creditor notices, claims or proceedings and failure to obtain acceptable revised terms; going-concern and financing risks; exploration, geological, sampling, assay, QA/QC and metallurgical variability; the possibility that exploration will not result in mineral resources or reserves; delays or adverse outcomes in technical studies, permitting, financing or a potential U.S. listing; changes in commodity markets, regulation or tax regimes; operational, infrastructure, environmental, stakeholder and labour risks; and risks affecting carbon-removal methodologies, measurement, verification, certification, permanence and pricing. Additional risk factors are described in the Company’s most recent Annual Information Form and other continuous disclosure filings on SEDAR+. The foregoing list is not exhaustive, and there can be no assurance that forward-looking statements will prove accurate.
Readers are cautioned not to place undue reliance on forward-looking statements. Except as required by applicable law, the Company disclaims any intention or obligation to update or revise any forward-looking statements, whether as a result of new information, future events or otherwise.
Financial Outlook / Future-Oriented Financial Information
This news release may contain future-oriented financial information or financial outlooks (“FOFI”) within the meaning of applicable securities laws, including expectations regarding liquidity preservation, commercial execution and future operating performance. Such FOFI is provided to describe management’s current expectations and may not be appropriate for other purposes. It is based on the assumptions and subject to the risks described above, and actual results may vary materially. This release does not provide rare earth production guidance, recovery guidance, project economics or a development decision.
Currency, Units and Trademarks
Unless otherwise stated, all figures are in Canadian dollars (C$). Tonnages are metric tons.
Third Party Sources
This news release contains information concerning the Company’s industry and the markets in which it operates, which is based on information from independent third-party sources. Although management of the Company believes these sources to be generally reliable, market and industry data is inherently imprecise, subject to interpretation and cannot be verified with complete certainty due to limits on the availability and reliability of raw data, the voluntary nature of the data gathering process, and other limitations and uncertainties inherent in any statistical survey or data collection process. Management of the Company has not independently verified any third-party information contained herein.
Consolidated Statement of Profit or Loss[11]
For the three and six months ended 30 June 2026
All amounts expressed in Canadian dollars.
|
3 Months ended
30 June 2026
$’000 |
3 Months ended
30 June 2025
$’000 |
6 Months ended
30 June 2026
$’000 |
6 Months ended
30 June 2025
$’000 |
| Revenue |
3,425 |
4,800 |
5,102 |
7,652 |
| Cost of sales |
(1,638) |
(2,049) |
(3,063) |
(3,541) |
| Gross Profit |
1,787 |
2,751 |
2,039 |
4,111 |
|
| Sales and distribution expenses |
(2,310) |
(1,714) |
(3,662) |
(3,680) |
| Administrative expenses |
(1,594) |
(2,063) |
(2,758) |
(3,826) |
| Operating (Loss) / Profit |
(2,117) |
(1,026) |
(4,381) |
(3,395) |
|
| Finance income |
108 |
60 |
187 |
133 |
| Finance costs |
(1,623) |
(1,454) |
(3,166) |
(2,935) |
| Loss before tax from continuing operations |
(3,632) |
(2,420) |
(7,360) |
(6,197) |
|
| Income tax expense |
(5) |
(6) |
(6) |
(10) |
| Loss for the period |
(3,637) |
(2,426) |
(7,366) |
(6,207) |
| Loss per share ($) |
3 Months ended
30 June 2026 |
3 Months ended
30 June 2025 |
6 Months ended
30 June 2026 |
6 Months ended
30 June 2025 |
| Basic and diluted loss per share |
(0.064) |
(0.046) |
(0.131) |
(0.118) |
Consolidated Statement of Financial Position[12]
As at 30 June 2026
All amounts expressed in Canadian dollars.
| Assets |
30 June 2026 |
31 Dec 2025 |
|
($’000) |
($’000) |
| Property, plant and equipment |
42,380 |
39,445 |
| Right-of-use asset |
– |
– |
| Mineral properties |
19,586 |
18,374 |
| Other assets |
435 |
396 |
| Deferred tax asset |
2,848 |
2,595 |
| Total non-current assets |
65,249 |
60,810 |
| Inventory |
1,839 |
1,376 |
| Trade and other receivables |
5,699 |
5,311 |
| Other financial assets |
– |
– |
| Cash and cash equivalents |
4,115 |
2,985 |
| Total current assets |
11,653 |
9,672 |
| Total assets |
76,902 |
70,482 |
| Issued capital |
21,342 |
20,664 |
| Capital contribution |
49,862 |
49,862 |
| Warrants reserve |
3,374 |
– |
| Merger reserve |
(4,557) |
(4,557) |
| Translation reserve |
(14,015) |
(14,924) |
| Accumulated losses |
(37,526) |
(30,262) |
| Total equity |
18,480 |
20,783 |
| Interest-bearing loans and borrowings |
48,316 |
41,997 |
| Lease liabilities |
– |
– |
| Provisions |
139 |
128 |
| Total non-current liabilities |
48,455 |
42,125 |
| Trade and other payables |
3,178 |
2,148 |
| Interest-bearing loans and borrowings |
6,783 |
5,421 |
| Lease liabilities |
– |
– |
| Other financial liabilities |
6 |
5 |
| Total current liabilities |
9,967 |
7,574 |
| Total liabilities |
58,422 |
49,699 |
| Total equity and liabilities |
76,902 |
70,482 |
[1] Read more at: Magnes Rare Earths Reports 10 m From Surface at 0.97% TREO at Minas Americas Rare Earth Project.
[2] Source: Brazilian Ministry of Mines and Energy (MME), “Final Report – Support for the Preparation of the National Rare Earths Strategy” (June 9, 2026).
[3] Sources: Brazilian Ministry of Mines and Energy (MME), “Brazil Establishes a State Strategy to Transform Mineral Wealth into Sustainable Development While Strengthening National Sovereignty Through 2050” (July 2, 2026), and “MME Ordinance No. 924 of July 2, 2026 – Approval of the National Mining Plan 2050” (published in the Federal Official Gazette on July 7, 2026).
[4] Source: Federal Senate of Brazil, “Bill No. 2,780/2024 – National Policy for Critical and Strategic Minerals” (legislative record). As of July 29, 2026, the bill remained under Senate consideration; Urgency Request No. 506/2026 had been received on July 6, 2026.
[5] Sources: Central Bank of Brazil, “Minutes of the Meeting of the Monetary Policy Committee – Copom, 279th Meeting, June 16-17, 2026” and, “Minutes of the Meeting of the Monetary Policy Committee – Copom, 280th Meeting, August 04-05, 2026”
[6] Source: Poder360, “Agribusiness Judicial Reorganizations Reach Record High, Up 66% in One Year” (August 4, 2026), based on the RGF-Bizdoc Monitor.
[7] Source: Reuters, “Soaring fertilizer prices dim Brazilian farmers’ edge over U.S. rivals” (June 8, 2026).
[8] Sources: Reuters, “Brazil’s economy forecast to grow moderately after October presidential vote” (July 13, 2026), and NOAA Climate Prediction Center, “ENSO Diagnostic Discussion” (July 9, 2026).
[9] Source: Reuters – “Big Grain Crops Mask Shrinking Margin for Error” (July 16, 2026). Available at: Reuters article
[10] The timing and extent of any improvement remain uncertain and would depend on a sustained improvement in grower economics.
[11] For important notes and disclosures, please refer to the Company’s Q2 2026 full consolidated financial statements and accompanying notes.
[12] For important notes and disclosures, please refer to the Company’s Q2 2026 full consolidated financial statements and accompanying notes.
Belo Horizonte, Brazil and Singapore, May 13, 2026 – Verde AgriTech Ltd (TSX: NPK | OTCQX: VNPKF) (“Verde” or the “Company”), today reported its financial results for the period ended March 31, 2026 (“Q1 2026”).
“Q1 2026 showed the value of discipline in a credit-constrained Brazilian agricultural market. Verde chose to prioritize liquidity, receivables quality and higher-quality counterparties over higher-risk volume. That approach reduced short-term sales, but it also supported a modest year-over-year improvement in EBITDA before non-cash events, a near-zero expected credit loss allowance and a stronger cash position following the brokered private placement completed in March 2026,” stated Cristiano Veloso, Founder and CEO of Verde.
“We are also taking decisive actions to align the cost base with current market conditions while preserving the capabilities required to serve customers and advance strategic priorities. These actions include supplier contract reviews, contract renegotiations, workforce reductions and tighter discretionary-spend controls. Subject to timing, completion and market conditions, we expect these initiatives to generate approximately BRL 9.4 million of annualized savings over the 12 months following implementation,” Mr. Veloso added.
First Quarter 2026 Financial Highlights
All figures are in Canadian dollars unless otherwise stated.
- Revenue in Q1 2026 was $1.7 million compared to $2.9 million in Q1 2025 and sales volume totaled 26,795 tons in Q1 2026 compared to 47,829 tons in Q1 2025. The decline reflected three linked drivers: tighter agricultural credit across Brazil, weaker near-term grower and distributor liquidity, and Verde’s more selective credit approvals in response to elevated sector insolvency risk. Management prioritized receivables quality and liquidity over higher-risk volume.
- Allowance for expected credit losses declined to $0.02 million in Q1 2026 from $0.5 million in Q1 2025.
- EBITDA before non-cash events improved modestly to $(1.36) million in Q1 2026 from $(1.43) million in Q1 2025, despite a 41% revenue decline, as lower expected credit losses and reduced sales and marketing expenses partly offset lower gross profit.
- Net loss narrowed to $(3.7) million in Q1 2026 from $(3.8) million in Q1 2025.
- As of March 31, 2026, the Company held $6.4 million in cash and $5.2 million in short-term receivables, compared to $2.5 million and $7.7 million, respectively, in the same period of 2025. The increase in cash position primarily reflects the brokered private placement completed in March 2026 for net proceeds of $4.0 million.
Q1 2026 Sustainability Results
In Q1 2026, product sold by Verde had the potential to capture up to 3,444 tons of CO₂ through Enhanced Rock Weathering, with an estimated net carbon removal of 2,372 tons, while also avoiding 1,354 tons of CO₂e emissions by replacing potassium chloride fertilizers. Since production began in 2018, the combined potential carbon removal and avoided emissions total approximately 342,517 tons of CO₂. Additionally, 2,121 tons of chloride were prevented from entering soils in Q1 2026, bringing the cumulative total avoided since inception to 194,434 tons.
Magnetic Rare Earth Program Highlights
During Q1 2026, Verde continued to advance the Minas Americas Global Alliance rare earth program through resource definition drilling, 3D geological modelling and metallurgical work. Results announced on March 17, 2026 provided additional technical support for the exploration model, including MAV_AD_0028, which returned 10.0 metres from surface averaging 8,439 ppm TREO and 1,965 ppm MREO, including 5.0 metres averaging 11,032 ppm TREO and 2,717 ppm MREO. The program remains at an exploration and technical de-risking stage and is focused on work required to support preparation of a maiden NI 43-101 mineral resource estimate, subject to further drilling, technical work and Qualified Person review. No mineral resource estimate, mineral reserve, production guidance or project economics is being provided in this release and there is no certainty that further exploration will result in the delineation of mineral resources or mineral reserves, or that any development decision will be made. Mineralization identified to date is not necessarily indicative of future results.
Leonardo Deringer Fraga, P.Geo, is the Company’s designated “Qualified Person” for this news release within the meaning of National Instrument 43-101 – Standards of Disclosure for Mineral Projects (“NI 43-101”). Mr. Fraga has reviewed and approved the technical information contained herein.
Strategic Initiatives And Recent Events
Liquidity Preservation and Creditor Engagement Strategy
As previously announced by the Company on April 15, 2025, the civil court homologated Verde’s Debt Renegotiation Agreement, which provided for revised payment terms applicable to the Company’s financial creditors. Following a review of the Company’s liquidity position, working capital requirements, cash flow forecasts, debt-service obligations and available alternatives, the Board of Directors approved a liquidity preservation and creditor engagement strategy.
As part of this Board-approved strategy, the Company will suspend scheduled debt-service payments to its financial creditors under the Debt Renegotiation Agreement homologated by the Brazilian civil court and related financing agreements, as such payments become due going forward, while the Company engages with creditors regarding revised payment terms that are sustainable under current market conditions. The Company intends to seek waivers, standstill arrangements, amendments, extensions or other revised terms with such creditors.
The decision reflects the continued restrictive operating environment for Brazilian agriculture, limited credit availability, elevated interest rates, pressure on grower liquidity and the need to preserve working capital for the Company’s operations. The suspension of scheduled debt-service payments may result in creditor notices, claims or proceedings under applicable financing and debt renegotiation arrangements. The Company has retained specialized legal and restructuring advisors in Brazil to support the creditor engagement process, represent the Company where necessary and assist management and the Board in implementing the strategy in an orderly manner.
Fertilizer Market Conditions
Q1 2026 was shaped less by agronomic need than by credit transmission. The Selic rate remained at 15.00% for most of the quarter, was reduced to 14.75% on March 18, 2026, and was further reduced to 14.50% after quarter-end on April 29, 2026, while the Central Bank of Brazil Focus survey dated April 24, 2026 showed the market’s year-end 2026 Selic expectation at 13.00%, up from 12.50% four weeks earlier[1]. Financing conditions therefore remained restrictive for growers, distributors and cooperatives. Serasa Experian reported 1,990 agribusiness judicial recovery requests in 2025, up 56.4% from 2024, the highest level in its series[2].
The agronomic backdrop remained constructive. On April 14, 2026, Companhia Nacional de Abastecimento raised its 2025/26 Brazilian grain harvest estimate to 356.3 million tons, including projected record soybean production of 179.2 million tons and total corn production of 139.6 million tons[3]. However, strong production potential did not immediately translate into stronger fertilizer purchasing capacity, as farmers continued to manage liquidity after a period of high interest rates, tight rural credit and compressed crop economics.
Input affordability worsened after quarter-end as global fertilizer markets tightened. World Bank commodity data showed fertilizer prices rising 14% in April[4] and projected a 31% increase in 2026[5], while Reuters reported warnings of potential fertilizer supply disruptions linked to the Middle East conflict[6]. In Brazil, StoneX data showed local urea prices rising about 35% in two weeks, with buyers increasingly considering lower-cost alternatives[7]. For Verde, this volatility reinforces the strategic relevance of domestic potassium alternatives, but the principal near-term constraint remains financing capacity and counterparty quality rather than agronomic demand.
Management therefore continued to prioritize counterparty selection, receivables protection and liquidity preservation over short-term volume, while aligning commercial efforts toward higher-quality accounts and higher-margin regions. This approach may cap near-term volumes, but it is intended to protect cash conversion, reduce credit risk and preserve Verde’s ability to capture demand if credit conditions and grower purchasing capacity improve.
Q1 2026 FINANCIAL RESULTS
The following table provides information about the three months ended March 31, 2026, as compared to the three months ended March 31, 2025.
| All amounts in CAD $’000 |
3 months ended
Mar 31, 2026 |
3 months ended
Mar 31, 2025 |
| Tons sold (‘000) |
27 |
48 |
| Average revenue per ton sold $ |
62 |
59 |
| Average production cost per ton sold $ |
(23) |
(16) |
| Average gross profit per ton sold $ |
39 |
44 |
| Average gross margin |
63% |
73% |
| |
|
|
| Revenue |
1,677 |
2,852 |
| Production costs |
(628) |
(757) |
| Gross Profit |
1,049 |
2,095 |
| Gross Margin |
63% |
73% |
| Sales and marketing expenses |
(727) |
(851) |
| Product delivery freight expenses |
(625) |
(1,115) |
| General and administrative expenses |
(1,033) |
(1,050) |
| Allowance for expected credit losses |
(24) |
(513) |
| EBITDA (1) |
(1,360) |
(1,434) |
| Share Based, Equity and Bonus Payments (Non-Cash Event) (2) |
(68) |
(161) |
| Depreciation and Amortization (3) |
(836) |
(774) |
| Operating (Loss) / Profit after non-cash events |
(2,264) |
(2,369) |
| Interest Income/Expense |
(1,464) |
(1,408) |
| Net (Loss) / Profit before tax |
(3,728) |
(3,777) |
| Income tax |
(1) |
(4) |
| Net (Loss) / Profit |
(3,729) |
(3,781) |
(1) Non-GAAP measure. EBITDA before non-cash events is calculated as operating loss before depreciation, amortization and non-cash events. Refer to the section entitled “Non-GAAP and Other Financial Measures” below.
(2) Included within General and Administrative expenses in the financial statements.
(3) Included within General and Administrative expenses and Cost of Sales in the financial statements.
Sales Performance
Revenue for Q1 2026 was $1.7 million compared to $2.9 million in Q1 2025. The decline was primarily driven by lower volumes in a market where customers faced tighter credit, weaker near-term cash generation and more selective purchasing behavior. Verde maintained a rigorous credit approval process, particularly for specialty fertilizer sales that include third-party raw materials and chose not to extend higher-risk terms that were not adequately compensated.
Production costs[8]
Average production cost per ton sold increased to $23 in Q1 2026 from $16 in Q1 2025, primarily due to lower sales volumes, which reduced fixed-cost absorption, and a less favorable product and packaging mix. Specialty products represented 8% of sales in Q1 2026 compared to 3% in Q1 2025, while big bag products represented 12% of sales versus 9% in the prior-year period. As a result, average gross profit per ton declined to $39 from $44, contributing to the reduction in gross margin to 63% in Q1 2026 from 73% in Q1 2025.
General and administrative expenses
General administrative expenses include general office expenses, rent, bank fees, insurance, foreign exchange variances and remuneration of executives, directors of the Board and administrative staff. Total general and administrative expenses decreased by 2% compared to the same period last year, due to a series of contract renegotiations with suppliers and a reduction in administrative headcount. Management is also reviewing supplier contracts, workforce structure and discretionary spending, and, subject to timing, completion and market conditions, expects related initiatives to generate approximately BRL 9.4 million of annualized savings over the 12 months following implementation.
Allowance for expected credit losses
The allowance for expected credit losses decreased from $0.5 million in Q1 2025 to $0.02 million in Q1 2026, primarily reflecting lower delinquency levels following the implementation of stricter credit policies.
Financial Results and Profitability
EBITDA before non-cash events for Q1 2026 improved modestly to $(1.36) million from $(1.43) million in Q1 2025, as materially lower expected credit losses and reduced sales, marketing and freight expenses partly offset lower gross profit from reduced volumes. Refer to the section entitled “Non-GAAP and Other Financial Measures” below.
Net loss for Q1 2026 was $(3.7) million, compared to a net loss of $(3.8) million in Q1 2025. Results continued to reflect elevated net finance expense in a high-interest rate environment, with net finance expense totaling $(1.5) million in the quarter compared to $(1.4) million in Q1 2025.
Basic loss per share totaled $(0.066) in Q1 2026, compared to $(0.072) in Q1 2025.
Liquidity, Debt and Working Capital
As of March 31, 2026, the Company held $6.4 million in cash and $5.2 million in short-term receivables. The higher cash balance primarily reflects completion of the brokered private placement in March 2026, which generated net proceeds of $4.0 million. Total loan balance was $52.2 million, of which $6.2 million was due within 12 months and $46.0 million was due thereafter, with an average interest rate of 16.75% per annum.
The Company ended Q1 2026 with positive working capital of $4.3 million. Current liabilities increased to $8.9 million from $2.9 million at March 31, 2025, primarily reflecting the scheduled reclassification of borrowings into the current portion as repayments come due following the renegotiated debt profile, rather than a deterioration in underlying liquidity.
Net cash used in operating activities narrowed to $(0.5) million in Q1 2026, compared to $(0.9) million in Q1 2025, primarily reflecting tighter credit underwriting and working capital management, which helped stabilize cash flow despite weaker sales.
Q1 2026 Financial Results Conference Call
The Company will host a conference call to discuss Q1 2026 results and provide an update on its magnetic rare earth program. Subscribe using the link below and receive the conference details by email.
The Company’s financial statements and related notes for the period ended March 31, 2026 are available to the public on SEDAR+ at www.sedarplus.ca and the Company’s website at www.investor.verde.ag/.
About Verde AgriTech
Verde AgriTech is a Brazil‑focused specialty fertilizer company listed on the TSX and OTCQX. The Company is advancing the Minas Americas Global Alliance rare earth project in Minas Gerais, Brazil, leveraging its operational platform and regional experience to accelerate exploration and technical de‑risking. For more information on how we are leading the way towards sustainable agriculture and climate change mitigation in Brazil, visit our website at https://verde.ag/en/home/.
For additional information please contact:
Cristiano Veloso, Chief Executive Officer and Founder
Tel: +55 (31) 3245 0205; Email: investor@verde.ag
www.verde.ag | www.investor.verde.ag
Non-GAAP and Other Financial Measures
Earnings before interest, taxes, depreciation and amortization (“EBITDA”) is not a generally accepted measure of financial performance under IFRS. Management of the Company utilizes EBITDA as a financial performance measure to assess profitability and return on equity in its decision-making. In addition, the Company, its lenders and investors use EBITDA to measure performance and value for various purposes. Investors are cautioned, however, that EBITDA should not be construed as an alternative to net loss attributable to common shareholders determined in accordance with IFRS as an indicator of the Company’s performance.
The Company’s method of calculating EBITDA may differ from other companies and, accordingly, they may not be comparable to similarly named measures used by other companies. A quantitative reconciliation of EBITDA is included below.
| Adjusted EBITDA Reconciliation |
3 months ended
Mar 31, 2026 |
3 months ended
Mar 31, 2025 |
| Net loss |
(3,729) |
(3,781) |
| Add (Deduct): |
|
|
| Interest Income/Expense |
1,464 |
1,408 |
| Income tax |
1 |
4 |
| Share-Based, Equity and Bonus Payments (Non-Cash Event) |
68 |
161 |
| Depreciation and Amortization |
836 |
774 |
| Adjusted EBITDA (1) |
(1,360) |
(1,434) |
(1) Refer to “Non-GAAP and Other Financial Measures” section of MD&A for discussion of non-IFRS measures used in this table.
Cautionary Language Regarding Forward-Looking Statements and Other Advisories
Forward-Looking Information and Forward-Looking Statements
This news release contains “forward-looking information” within the meaning of applicable Canadian securities laws and “forward-looking statements” within the meaning of the United States Private Securities Litigation Reform Act of 1995 (collectively, “forward-looking statements”). Forward-looking statements are made as of the date of this news release and relate to future events or performance. Often, but not always, forward-looking statements can be identified by words such as “expects,” “anticipates,” “plans,” “projects,” “estimates,” “envisages,” “assumes,” “intends,” “strategy,” “goals,” “objectives,” or variations (including negative variations) of such words and phrases, or statements that certain actions, events or results “may,” “could,” “would,” “might,” or “will” be taken, occur or be achieved.
Forward-looking statements in this news release include, without limitation, statements with respect to: (i) the potential amount of CO₂ removal per ton of rock during the financial period; (ii) the possibility of a future maiden NI 43-101 technical report in respect of the Minas Americas Global Alliance rare earth program and the potential timing of same; (iii) sales assumptions and the expected effects of restructuring initiatives; (iv) the Company’s competitive position in Brazil and potash market demand; (v) the terms, timing, court approval and financial impact of any debt restructuring; ; and (vi) expected annualized cost savings, implementation of expense controls, the liquidity preservation and creditor engagement strategy approved by the Board of Directors, including the suspension of scheduled debt-service payments under the Debt Renegotiation Agreement homologated by the civil court in Brazil and related financing agreements, and the Company’s efforts to obtain waivers, standstill arrangements, amendments, extensions or other revised terms.
These forward-looking statements are based on the Company’s and its consultants’ reasonable assumptions, estimates and opinions as of the date hereof, including, without limitation: (i) the presence and continuity of mineralization at estimated grades; (ii) geotechnical, hydrological and metallurgical characteristics of rock consistent with sampled results; (iii) foreign exchange rates; (iv) realized sales prices, market size and adoption for the Company’s products; (v) applicable discount, tax and royalty rates; (vi) availability and cost of acceptable financing; (vii) reasonable contingency allowances; (viii) successful execution of operating plans; and (ix) the Company’s ability to negotiate with creditors in connection with its efforts to restructure its Debt Renegotiation Agreement.
Forward-looking statements are inherently subject to known and unknown risks, uncertainties and other factors that may cause actual results to differ materially from those expressed or implied. Such risks and uncertainties include, without limitation: risks related to court approvals and the completion of any debt restructuring; variations in grade or recovery; adverse geotechnical, hydrological or metallurgical conditions; changes in project parameters as plans continue to be refined; cost escalation and inflationary pressures; labour availability; fluctuations in commodity prices and demand (including potash); foreign-exchange volatility (including Brazilian Real–Canadian dollar); availability and terms of financing; changes in agricultural credit conditions, customer insolvencies and collection risk; the Company’s ability to implement restructuring measures and realize expected cost savings; changes in tax and royalty regimes; delays in permitting or stakeholder agreements; competitive pressures; infrastructure and operational risks; regulatory changes affecting mining, fertilizers and carbon-removal markets; and, for carbon-removal activities, risks relating to methodology eligibility, additionality, durability/permanence, leakage, monitoring, verification, certification, policy shifts and pricing, any of which could affect the issuance, saleability or value of credits. Additional information about risk factors is described in the Company’s most recent Annual Information Form filed on SEDAR+ (www.sedarplus.ca) and in other continuous disclosure filings. The foregoing list is not exhaustive, and there can be no assurance that forward-looking statements will prove accurate. Additional risks include potential creditor notices, claims or proceedings under applicable financing and debt renegotiation arrangements, the outcome of creditor discussions and the Company’s ability to manage the process with the support of specialized legal and restructuring advisors.
Readers are cautioned not to place undue reliance on forward-looking statements. Except as required by applicable law, the Company disclaims any intention or obligation to update or revise any forward-looking statements, whether as a result of new information, future events or otherwise.
Financial Outlook / Future-Oriented Financial Information
This news release may contain future-oriented financial information or financial outlooks (collectively, “FOFI”) within the meaning of applicable securities laws, including, without limitation, management’s expectations regarding near-term sales volumes, expected annualized cost savings, the effects of restructuring initiatives, liquidity preservation and, where applicable, estimates of capital and operating costs, net present value, internal rate of return, payback and projected revenues or cash flows. Such FOFI is provided to describe management’s current expectations regarding the Company’s business, market conditions and proposed project development and may not be appropriate for other purposes. The FOFI is based on the assumptions and subject to the risks described above, and actual results may vary materially.
Currency, Units and Trademarks
Unless otherwise stated, all figures are in Canadian dollars (C$). Tonnages are metric tons.
Third Party Sources
This news release contains information concerning the Company’s industry and the markets in which it operates, which is based on information from independent third-party sources. Although management of the Company believes these sources to be generally reliable, market and industry data is inherently imprecise, subject to interpretation and cannot be verified with complete certainty due to limits on the availability and reliability of raw data, the voluntary nature of the data gathering process, and other limitations and uncertainties inherent in any statistical survey or data collection process. Management of the Company has not independently verified any third-party information contained herein.
Consolidated Statement Of Profit or Loss[9]
For the quarter ended 31 March 2026
All amounts expressed in Canadian Dollars.
| |
3 Months ended
31 Mar 2026
$’000
|
3 Months ended
31 Mar 2025
$’000
|
| Revenue |
1,677 |
2,852 |
| Cost of sales |
(1,425) |
(1,492) |
| Gross Profit |
252 |
1,360 |
| |
|
|
| Sales and distribution expenses |
(1,352) |
(1,966) |
| Administrative expenses |
(1,164) |
(1,763) |
| Operating (Loss) / Profit |
(2,264) |
(2,369) |
| |
|
|
| Finance costs |
(1,543) |
(1,481) |
| Finance income |
79 |
73 |
| Loss before tax from continuing operations |
(3,728) |
(3,777) |
| |
|
|
| Income tax expense |
(1) |
(4) |
| Loss for the quarter |
(3,729) |
(3,781) |
| Loss per share ($) |
3 Months ended
31 Mar 2026
|
3 Months ended
31 Mar 2025
|
| Basic and dilutive loss per share |
(0.066) |
(0.072) |
Consolidated statement of financial position[10]
As at 31 March 2026
All amounts expressed in Canadian Dollars.
|
Assets |
31 March 2026 |
31 Dec 2025 |
| |
|
| ($’000) |
($’000) |
| Property, plant and equipment |
41,572 |
39,445 |
| Mineral properties |
19,267 |
18,374 |
| Other assets |
424 |
396 |
| Deferred tax asset |
2,777 |
2,595 |
| Total non-current assets |
64,040 |
60,810 |
| Inventory |
1,561 |
1,376 |
| Trade and other receivables |
5,176 |
5,311 |
| Cash and cash equivalents |
6,385 |
2,985 |
| Total current assets |
13,122 |
9,672 |
| Total assets |
77,162 |
70,482 |
| |
|
|
|
| Issued capital |
21,342 |
20,664 |
| Capital contribution |
49,862 |
49,862 |
| Warrants reserve |
3,374 |
– |
| Merger reserve |
(4,557) |
(4,557) |
| Translation reserve |
(13,960) |
(14,924) |
| Accumulated losses |
(33,923) |
(30,262) |
| Total equity |
22,138 |
20,783 |
| Liabilities |
|
|
|
|
| Interest-bearing loans and borrowings |
46,037 |
41,997 |
| Provisions |
137 |
128 |
| Total non-current liabilities |
46,174 |
42,125 |
| Trade and other payables |
2,663 |
2,148 |
| Interest-bearing loans and borrowings |
6,181 |
5,421 |
| Other financial liabilities |
6 |
5 |
| Total current liabilities |
8,850 |
7,574 |
| Total liabilities |
55,024 |
49,699 |
| Total equity and liabilities |
77,162 |
70,482 |
|
|
|
|
|
|
|
|
[1] Source: Banco Central do Brasil – Copom Minutes and Selic Rate Decisions.
[2] Source: Serasa Experian – Judicial Reorganization: Agribusiness closes 2025 with almost 2,000 requests for this recourse and registers the highest accumulated total in the historical series, reveals Serasa Experian.
[3] Source: Companhia Nacional de Abastecimento – Grain harvest could reach 356.3 million tons in 2025/26, influenced by good yields.
[4] Source: World Bank – Commodity prices rose in April – Pink Sheet (May 5, 2026);
[5] Source: World Bank – Commodity Markets Outlook, April 2026.
[6] Source: Reuters – Expanding Iran conflict threatens Brazil grain exports, fertilizer supplies (March 5, 2026).
[7] Source: Reuters – Brazil sounds alarm on fertilizers as price spike spurs cheaper alternatives (March 18, 2026);
[8] Verde’s production costs and sales price are based on the following assumptions:
- Micronutrients added to the product increase production cost, rendering the applicable product more expensive to produce.
- Production costs vary based on packaging type, with bulk being less expensive than Jumbo Bags.
- Plant 1 produces The Product® Jumbo Bags and Low-Carbon Specialty Fertilizer Products, while Plant 2 exclusively produces The Product® Bulk. Therefore, Plant 2’s production costs are lower than Plant 1’s costs.
[9] For important notes and disclosures, please refer to the Company’s Q1 2026 full consolidated financial statements and accompanying notes.
[10] For important notes and disclosures, please refer to the Company’s Q1 2026 full consolidated financial statements and accompanying notes.
All figures are in Canadian dollars unless otherwise stated.
Belo Horizonte, Brazil and Singapore, March 26, 2026 – Verde AgriTech Ltd (TSX: NPK | OTCQX: VNPKF) (“Verde” or the “Company”), today reported its operating and financial results for the fourth quarter and fiscal year ended December 31, 2025 (“Q4 2025” and “FY 2025”).
“The Great Brazilian Agriculture Crisis continued to weigh on sales throughout 2025, and the sharp rise in judicial recovery filings across Brazil’s agribusiness sector shows how stressed the market remains. Since the crisis began in 2023, Verde has maintained a highly restrictive credit approval policy, prioritizing receivables quality, liquidity preservation and commercial discipline over volume at any cost. We believe this has been the right approach to protect the Company and preserve its ability to grow when sector credit conditions begin to normalize” stated Cristiano Veloso, Founder and CEO of Verde AgriTech.
Fourth Quarter And Full Year 2025 Financial Highlights
FY 2025 was a year of disciplined credit-risk management in a highly stressed Brazilian agricultural input market. Q4 2025 provided early evidence of improved commercial quality, with higher revenue per ton and materially lower expected credit losses.
- Revenue in FY 2025 was $16.6 million compared to $21.6 million in FY 2024. In Q4 2025 revenue increased to $3.1 million from $2.9 million in Q4 2024.
- Sales Volume totaled 258,432 tons in FY 2025 compared to 318,870 tons in FY 2024 and 45,113 tons in Q4 2025 versus 47,888 tons in Q4 2024 as deteriorating credit conditions across Brazilian agriculture and the Company’s tighter credit approvals reduced higher-risk sales, with Verde prioritizing receivables quality and liquidity over volume.
- Gross margin remained resilient at 72% in FY 2025 compared to 71% in FY 2024. In Q4 2025 Gross Margin was 63% compared to 65% in Q4 2024.
- Allowance for expected credit losses declined to $0.9 million in FY 2025 from $2.3 million in FY 2024. In Q4 2025, allowance for expected credit losses declined to $0.3 million from $1.3 million in Q4 2024.
- EBITDA before non-cash events remained stable year over year at $(2.8) million despite lower FY 2025 revenue. In Q4 2025, EBITDA improved to $(1.3) million from $(2.1) million in Q4 2024.
- Net loss narrowed to $(11.7) million in FY 2025 from $(12.6) million in FY 2024. In Q4 2025, net loss was $(3.4) million compared to $(2.8) million in Q4 2024.
- As of December 31, 2025, the Company held $3.0 million in cash and $5.3 million in short-term receivables. Subsequent to year-end, the Company completed a brokered private placement for gross proceeds of $4.5 million[1].
Q4 2025 and FY 2025 Sustainability Results
In Q4 2025, product sold by Verde had the potential to capture up to 5,414 tons of CO₂ through Enhanced Rock Weathering, with an estimated net carbon removal of 3,940 tons, while also avoiding 2,373 tons of CO₂e emissions by replacing potassium chloride fertilizers. Since production began in 2018, the combined potential carbon removal and avoided emissions total approximately 337,719 tons of CO₂. Additionally, 3,571 tons of chloride were prevented from entering soils in Q4 2025, bringing the cumulative total avoided since inception to 192,313 tons.
Magnetic Rare Earth Program Highlights
Since first disclosing its district-scale clay-hosted rare earth discovery in Minas Gerais, Brazil in October 2025, and formally naming it the Minas Americas Global Alliance Project later that month, Verde has advanced a growing drill-confirmed clay-hosted rare earth discovery, with the footprint now exceeding 3.5 km² within a mapped and surface-sampled geological unit exceeding 15 km² and drilling ongoing across eight additional targets. Metallurgical work has confirmed ionic-adsorption behaviour, with leach tests returning up to 667 mg/kg of DREO and 278 mg/kg of MREO in primary leach solution, while thorium and uranium were at or below detection in the best intervals. Drilling has consistently intersected shallow mineralization from surface, including 14.2 metres averaging 6,858 ppm TREO and 1,673 ppm MREO, 13.0 metres averaging 0.83% TREO including 8.0 metres at 1.01% TREO, and, most recently, 10.0 metres averaging 8,439 ppm TREO and 1,965 ppm MREO, including 5.0 metres averaging 11,032 ppm TREO and 2,717 ppm MREO. These results are supporting 3D modelling, representative metallurgical composites and continued advancement toward a maiden resource.
Strategic Initiatives And Recent Events
Brokered LIFE Financing[2]
Subsequent to year-end, the Company completed a brokered private placement for gross proceeds of $4.5 million (approximately $4.0 million net after commissions, transaction fees and offering-related costs). The Company intends to use the net proceeds raised from the Offering to accelerate work at its Minas Americas Global Alliance rare earth project, including resource definition drilling, metallurgy optimization, and other technical de-risking required for maiden NI 43-101 and for working capital and general corporate purposes.
Fertilizer Market Conditions and 2026 Outlook
Brazil’s agricultural input market remained under significant financial pressure throughout 2025. On March 18, 2026, Central Bank of Brazil reduced the Selic rate to 14.75% from 15.00[3]%, but financing conditions remain highly restrictive for growers and agricultural distributors. Serasa Experian reported 1,990 agribusiness judicial recovery requests in 2025, up 56.4% from 2024, underscoring the degree of financial stress across the sector[4]. In this environment, credit availability became the principal commercial constraint, as purchasing decisions were driven by liquidity preservation, restricted financing and lower willingness to assume credit risk across the distribution chain.
Farm economics were also pressured by an unfavorable spread between costs and crop prices. The World Bank reported that fertilizer prices increased nearly every month during 2025, while food commodity prices were 5% lower than a year earlier[5]. This divergence compressed profitability across several crops and reduced producers’ capacity to commit cash to input purchases. In soybeans, one of Brazil’s key farm-economics benchmarks, recent analysis indicates that margins are approaching breakeven as lower soybean prices, elevated production costs and weak port premiums continue to pressure returns[6].
The agronomic backdrop itself remains constructive, with the Companhia Nacional de Abastecimento (Conab) projecting a record Brazilian grain harvest in 2025/26. However, stronger production does not immediately repair producer balance sheets after two years of tighter credit, higher financing costs and weaker cash generation. Conab has also indicated that soybean trading entered 2026 at a slow pace and under defensive demand conditions[7], reinforcing the view that many growers may continue to shorten purchasing windows and delay commercial decisions despite solid crop fundamentals. Taken together, these indicators suggest that the near-term constraint is credit availability and growers’ ability to finance purchases, rather than agronomic demand.
Looking ahead, Verde believes market conditions are likely to remain challenging in the near term, with tighter agricultural credit continuing to constrain fertilizer sales. According to Agrinvest Commodities Consultoria, fertilizer purchases for the 2026/27 season in the Company’s key markets are running at roughly half the historical pace for this point in the season. Against this backdrop, the Company expects Q1 2026 sales volumes to remain below the prior year. In response, Verde is implementing strategic adjustments across the business, including workforce reductions, contract reviews and other cost-efficiency initiatives, which are expected to generate over BRL 6 million in savings over 12 months. Together with a sharper commercial focus on higher-margin regions and assuming the current fertilizer price environment is sustained, these actions are expected to support positive EBITDA in 2026, even at sales volumes broadly in line with 2025.
[1] Learn More at: Verde AgriTech Announces Closing of $4.5 Million LIFE Financing With Majority Subscribed by Leading Resources Institutional Investor.
[2] Learn More at: Verde AgriTech Announces Closing of $4.5 Million LIFE Financing With Majority Subscribed by Leading Resources Institutional Investor.
[3] Source: Banco Central do Brasil – Copom Minutes and Selic Rate Decisions.
[4] Source: Serasa Experian. Judicial Reorganization: Agribusiness closes 2025 with almost 2,000 requests for this recourse and registers the highest accumulated total in the historical series, reveals Serasa Experian (March 9, 2026).
[5] Source: World Bank. Food Security Update 119.
[6] Source: Conab. Logistics Bouletin (February 26, 2026).
[7] Source: Conab. Grain-harvest survey release (March 13, 2026).
Q4 2025 AND FY 2025 FINANCIAL RESULTS
The following table provides information about the three and twelve months ended December 31, 2025, as compared to the three and twelve months ended December 31, 2024.
| All amounts in CAD $’000 (except per ton) |
3 months ended
Dec 31, 2025 |
3 months ended
Dec 31, 2024 |
12 months ended
Dec 31, 2025 |
12 months ended
Dec 31, 2024 |
| Tons sold (‘000) |
45 |
48 |
258 |
319 |
| Average revenue per ton sold $ |
68 |
60 |
64 |
68 |
| Average Production cost per ton sold $ |
(25) |
(21) |
(18) |
(20) |
| Average Gross Profit per ton sold $ |
43 |
39 |
46 |
48 |
| Gross Margin |
63% |
65% |
72% |
71% |
| |
|
|
|
|
| Revenue |
3,080 |
2,888 |
16,605 |
21,597 |
| Production Costs |
(1,123) |
(986) |
(4,643) |
(6,302) |
| Gross Profit |
1,957 |
1,902 |
11,962 |
15,295 |
| Gross Margin |
63% |
65% |
72% |
71% |
| Sales and marketing expenses |
(813) |
(842) |
(3,462) |
(3,686) |
| Product delivery freight expenses |
(1,031) |
(938) |
(6,180) |
(7,705) |
| General and administrative expenses |
(1,186) |
(957) |
(4,239) |
(4,424) |
| Allowance for expected credit losses |
(259) |
(1,302) |
(929) |
(2,320) |
| EBITDA (1) |
(1,332) |
(2,137) |
(2,848) |
(2,840) |
| Non-Cash Events (2) |
(502) |
325 |
(727) |
(1,821) |
| Depreciation, amortization and gain/(loss) on disposal of plant and equipment (3) |
(873) |
(753) |
(3,217) |
(3,232) |
| Operating (Loss) / Profit after non-cash events |
(2,707) |
(2,565) |
(6,792) |
(7,893) |
| Net finance expense |
(667) |
(262) |
(4,858) |
(4,634) |
| Net (Loss) / Profit before tax |
(3,374) |
(2,827) |
(11,650) |
(12,527) |
| Income tax |
(3) |
(4) |
(20) |
(31) |
| Net (Loss) / Profit |
(3,377) |
(2,831) |
(11,670) |
(12,558) |
(1) Non-GAAP measure. EBITDA before non-cash events is calculated as operating loss before depreciation, amortization and non-cash events.
(2) Included within General and Administrative expenses in the financial statements. For FY 2025, this amount includes the accounting recognition associated with the transfer of mineral rights to Oby Rare Earths and expenses related to stock options granted during the period. Comparative period amounts relate to non-cash items recognized in the respective periods.
(3) Included within General and Administrative expenses and Cost of Sales in the financial statements.
Sales Performance
Revenue for FY 2025 was $16.6 million compared to $21.6 million in FY 2024. The decline was primarily driven by lower volumes in a market where growers faced tighter credit conditions and weaker near-term cash generation. Verde maintained a rigorous credit approval process, particularly for specialty fertilizer sales that include third-party raw materials and chose to limit higher-risk exposure rather than extend terms that were not adequately compensated.
General and administrative expenses
Expenses decreased to $4.2 million in FY 2025 from $4.4 million in FY 2024, primarily reflecting lower legal, professional and consulting expenses over the course of the year. In Q4 2025, G&A increased to $1.2 million from $1.0 million in Q4 2024, mainly due to the recognition of a provision for success-based legal fees associated with the Company’s debt renegotiation and restructuring efforts.
Allowance for expected credit losses
The allowance for expected credit losses decreased from $2.3 million in 2024 to $0.9 million in 2025, primarily reflecting lower delinquency levels following the implementation of stricter credit policies.
Financial Results and Profitability
EBITDA before non-cash events for FY 2025 was $(2.8) million compared to $(2.8) million in FY 2024.
Net loss for FY 2025 was $(11.7) million, compared to a net loss of $(12.6) million in FY 2024. Results continued to reflect elevated net finance expense in a high-interest rate environment.
Basic loss per share totaled $(0.22) in FY 2025, compared to $(0.24) in FY 2024.
Liquidity, Debt and Working Capital
As of December 31, 2025, the Company held $3.0 million in cash and $5.3 million in short-term receivables. Total loan balance was $47.4 million, of which $5.4 million was due within 12 months and $42.0 million was due thereafter, with an average interest rate of 17% per annum.
The Company ended FY 2025 with positive working capital of $2.1 million. The year-over-year increase in current liabilities primarily reflects the scheduled reclassification of borrowings into the current portion as repayments come due following the renegotiated debt profile, rather than a deterioration in underlying liquidity.
Net cash used in operating activities narrowed materially to $(0.03) million in FY 2025, compared to $(1.9) million in FY 2024, primarily reflecting tighter credit underwriting and working capital management, which helped stabilize cash flow despite weaker sales.
Q4 & FY 2025 Financial Results Conference Call
The Company will host a conference call to discuss Q4 & FY 2025 results and provide an update on its magnetic rare earth program. Subscribe using the link below and receive the conference details by email.
The Company’s financial statements and related notes for the year ended December 31, 2025 are available to the public on SEDAR+ at www.sedarplus.ca and the Company’s website at www.investor.verde.ag/.
About Verde AgriTech
Verde AgriTech is a Brazil‑focused specialty fertilizer company listed on the TSX and OTCQX. The Company is advancing the Minas Americas Global Alliance rare earth project in Minas Gerais, Brazil, leveraging its operational platform and regional experience to accelerate exploration and technical de‑risking. For more information on how we are leading the way towards sustainable agriculture and climate change mitigation in Brazil, visit our website at https://verde.ag/en/home/.
For additional information please contact:
Cristiano Veloso, Chief Executive Officer and Founder
Tel: +55 (31) 3245 0205; Email: investor@verde.ag
www.verde.ag | www.investor.verde.ag
Cautionary Language and Forward-Looking Statements
Cautionary Note Regarding Mineral Resources and Reserves (NI 43-101 / CIM)
Unless otherwise indicated, all scientific and technical information in this news release has been prepared in accordance with National Instrument 43-101 – Standards of Disclosure for Mineral Projects (“NI 43-101”) and the Canadian Institute of Mining, Metallurgy and Petroleum (“CIM”) Definition Standards (May 10, 2014). Mineral Resources that are not Mineral Reserves do not have demonstrated economic viability. Inferred Mineral Resources are considered too speculative geologically to have economic considerations applied to them that would enable them to be categorized as Mineral Reserves, and there is no certainty that any part of an Inferred Mineral Resource will be converted into Measured or Indicated Mineral Resources or into Mineral Reserves. The results of any preliminary economic assessment (“PEA”) or pre-feasibility study (“PFS”), to the extent referenced, are preliminary in nature and include inferred Mineral Resources that are considered too speculative geologically to have economic considerations applied to them that would enable them to be categorized as Mineral Reserves; there is no certainty that the PEA or PFS results will be realized.
Cautionary Note to U.S. Investors
The terms “Mineral Resource,” “Inferred Mineral Resource,” “Indicated Mineral Resource,” and “Measured Mineral Resource,” and “Mineral Reserve,” as used herein, are defined in accordance with NI 43-101 and the CIM Definition Standards, which differ in certain respects from the requirements of the U.S. Securities and Exchange Commission (“SEC”), including Subpart 1300 of Regulation S-K (“S-K 1300”). Accordingly, information contained herein may not be comparable to similar information made public by U.S. companies subject to the SEC’s reporting and disclosure requirements.
Forward-Looking Information and Forward-Looking Statements
This news release contains “forward-looking information” within the meaning of applicable Canadian securities laws and “forward-looking statements” within the meaning of the United States Private Securities Litigation Reform Act of 1995 (collectively, “forward-looking statements”). Forward-looking statements are made as of the date of this news release and relate to future events or performance. Often, but not always, forward-looking statements can be identified by words such as “expects,” “anticipates,” “plans,” “projects,” “estimates,” “envisages,” “assumes,” “intends,” “strategy,” “goals,” “objectives,” or variations (including negative variations) of such words and phrases, or statements that certain actions, events or results “may,” “could,” “would,” “might,” or “will” be taken, occur or be achieved.
Forward-looking statements in this news release include, without limitation, statements with respect to: (i) estimates of the tonnage and grades of Mineral Resources and Mineral Reserves; (ii) the potential amount of CO₂ removal per ton of rock and the development, verification, issuance and sale of carbon-removal credits; (iii) the PFS representing a viable development option for the Project and the timing of related disclosures; (iv) estimates of initial and sustaining capital costs, operating and total costs, payback periods, net cash flow, net present value and economic returns; (v) future production volumes (produced and sold), near-term sales volumes, sales assumptions and the expected effects of restructuring initiatives; (vi) the Company’s competitive position in Brazil and potash market demand; (vii) recommendations of any special committee; (viii) the terms, timing, court approval and financial impact of any debt restructuring; and (ix) the potential outcomes of re-assaying certain core samples.
These forward-looking statements are based on the Company’s and its consultants’ reasonable assumptions, estimates and opinions as of the date hereof, including, without limitation: (i) the presence and continuity of Mineral Resources and Mineral Reserves at estimated grades; (ii) geotechnical, hydrological and metallurgical characteristics of rock consistent with sampled results; (iii) capacities, availability and performance of equipment and personnel at estimated costs and timelines; (iv) foreign exchange rates; (v) realized sales prices, market size and adoption for the Company’s products; (vi) applicable discount, tax and royalty rates; (vii) availability and cost of acceptable financing; (viii) anticipated mining loss and dilution; (ix) receipt of required permits and other regulatory approvals on acceptable terms; (x) reasonable contingency allowances; (xi) successful execution of operating plans; (xii) the fulfilment of environmental assessment commitments and community arrangements; and (xiii) for carbon-removal activities, the applicability of methodologies, verification, permanence, monitoring and market acceptance.
Forward-looking statements are inherently subject to known and unknown risks, uncertainties and other factors that may cause actual results to differ materially from those expressed or implied. Such risks and uncertainties include, without limitation: risks related to court approvals and the completion of any debt restructuring; variations in grade or recovery; adverse geotechnical, hydrological or metallurgical conditions; changes in project parameters as plans continue to be refined; cost escalation and inflationary pressures; labour availability; fluctuations in commodity prices and demand (including potash); foreign-exchange volatility (including Brazilian Real–Canadian dollar); availability and terms of financing; changes in agricultural credit conditions, customer insolvencies and collection risk; the Company’s ability to implement restructuring measures and realize expected cost savings; changes in tax and royalty regimes; delays in permitting or stakeholder agreements; competitive pressures; infrastructure and operational risks; regulatory changes affecting mining, fertilizers and carbon-removal markets; and, for carbon-removal activities, risks relating to methodology eligibility, additionality, durability/permanence, leakage, monitoring, verification, certification, policy shifts and pricing, any of which could affect the issuance, saleability or value of credits. Additional information about risk factors is described in the Company’s most recent Annual Information Form filed on SEDAR+ (www.sedarplus.ca) and in other continuous disclosure filings. The foregoing list is not exhaustive, and there can be no assurance that forward-looking statements will prove accurate.
Readers are cautioned not to place undue reliance on forward-looking statements. Except as required by applicable law, the Company disclaims any intention or obligation to update or revise any forward-looking statements, whether as a result of new information, future events or otherwise.
Financial Outlook / Future-Oriented Financial Information
This news release may contain future-oriented financial information or financial outlooks (collectively, “FOFI”) within the meaning of applicable securities laws, including, without limitation, management’s expectations regarding near-term sales volumes, the effects of restructuring initiatives, liquidity preservation and, where applicable, estimates of capital and operating costs, net present value, internal rate of return, payback and projected revenues or cash flows. Such FOFI is provided to describe management’s current expectations regarding the Company’s business, market conditions and proposed project development and may not be appropriate for other purposes. The FOFI is based on the assumptions and subject to the risks described above, and actual results may vary materially.
Currency, Units and Trademarks
Unless otherwise stated, all figures are in Canadian dollars (C$). Tonnages are metric tons.
Consolidated Statement Of Profit or Loss(1)
For the year ended 31 December 2025
All amounts expressed in Canadian Dollars.
|
2025
$’000 |
2024
$’000 |
| Revenue |
16,605 |
21,597 |
| Cost of sales |
(7,703) |
(9,350) |
| Gross Profit |
8,902 |
12,247 |
| |
|
|
| Sales and distribution expenses |
(9,642) |
(11,391) |
| Administrative expenses |
(6,052) |
(8,748) |
| Operating (Loss) |
(6,792) |
(7,892) |
|
|
|
| Finance costs |
(5,197) |
(5,108) |
| Finance income |
339 |
473 |
| (Loss) before tax from continuing operations |
(11,650) |
(12,527) |
|
|
|
| Income tax expense |
(20) |
(31) |
| (Loss) /for the year |
(11,670) |
(12,558) |
| Earnings per share ($) |
2025 |
2024 |
| Basic (loss) / per share |
(0.221) |
(0.238) |
| Diluted (loss) / per share |
(0.221) |
(0.238) |
(1) For important notes and disclosures, please refer to the Company’s Q4& FY full consolidated financial statements and accompanying notes.
Consolidated statement of financial position(1)
As at 31 December 2025
All amounts expressed in Canadian Dollars.
|
Assets |
2025 |
2024 |
| ($’000) |
($’000) |
| Property, plant and equipment |
39,445 |
39,865 |
| Right-of-use asset |
– |
34 |
| Mineral properties |
18,374 |
17,290 |
| Other assets |
396 |
366 |
| Deferred tax asset |
2,595 |
2,413 |
| Total non-current assets |
60,810 |
59,968 |
| Inventory |
1,376 |
1,709 |
| Trade and other receivables |
5,311 |
6,864 |
| Other financial assets |
– |
– |
| Cash and cash equivalents |
2,985 |
3,476 |
| Total current assets |
9,672 |
12,049 |
| Total assets |
70,482 |
72,017 |
|
| Equity attributable to the equity holders of the parent |
| Issued capital |
20,664 |
20,652 |
| Capital contribution |
49,862 |
49,862 |
| Merger reserve |
(4,557) |
(4,557) |
| Translation reserve |
(14,924) |
(16,750) |
| Accumulated losses |
(30,262) |
(18,872) |
| Total equity |
20,783 |
30,335 |
| Liabilities |
| Interest-bearing loans and borrowings |
41,997 |
39,444 |
| Lease liabilities |
– |
24 |
| Provisions |
128 |
155 |
| Total non-current liabilities |
42,125 |
39,623 |
| Trade and other payables |
2,148 |
1,740 |
| Interest-bearing loans and borrowings |
5,421 |
265 |
| Lease liabilities |
– |
17 |
| Other financial liabilities |
5 |
37 |
| Total current liabilities |
7,574 |
2,059 |
| Total liabilities |
49,699 |
41,682 |
| Total equity and liabilities |
70,482 |
72,017 |
(1)For important notes and disclosures, please refer to the Company’s Q4 & FY full consolidated financial statements and accompanying notes.
Singapore. November 12, 2025 — Verde AgriTech Ltd (TSX: NPK | OTCQX: VNPKF) (“Verde” or the “Company”) announces its operating and financial results for the period ended September 30, 2025 (“Q3 2025”). All figures are in Canadian dollars, unless stated otherwise. Average exchange rate in Q3 2025: C$1.00 = R$4.04.
“Verde has a great deal underway—both in Enhanced Rock Weathering and in our rare-earths exploration—and we look forward to updating the market on those fronts separately. Today’s release is deliberately focused on Q3 financial performance. The Great Brazilian Agriculture Crisis continues to weigh on demand, with elevated insolvencies across the sector, but we have executed with discipline: cutting costs, tightening credit, and concentrating on resilient, long-cycle customers. Our agronomic trials in eucalyptus and sugarcane are progressing well and are opening channels where a small group of buyers could, together, absorb volumes beyond our current capacity. While industry conditions remain challenging, Q3 shows clear sequential improvement and the operational rigor to keep building from here,” said Cristiano Veloso, Founder and Chief Executive Officer of Verde AgriTech.
Q3 2025 Highlights
Operational and Financial Highlights
- EBITDA before non-cash events was $0.1 million in Q3 2025, compared to -$0.03 in Q3 2024, representing the first positive EBITDA since Q2 2023.
- Sales volume in Q3 2025 was 85,136 tons; a 16% reduction compared to Q3 2024.
- Revenue in Q3 2025 was $5.9 million, an 18% decrease from the same period last year.
- Gross margin excluding freight was 60% during the quarter, in line with Q3 2024.
- Net loss in Q3 2025 was $2.1 million, compared to a $2.3 million loss in Q3 2024.
- Cash in Q3 2025 was $3.6 million, compared to $3.4 million in Q3 2024. Short-term receivables in the quarter were $7.9 million, compared to $11.3 million in Q3 2024.
- During the period, Verde was granted a Brazilian patent for its advanced fertilizer production technology combining glauconitic siltstone and beneficial microorganisms. The Company holds five patents in Brazil with National Institute of Industrial Property (INPI) and has three patent applications pending.
Sustainability Highlights
- Product sold in Q3 2025 has the potential to capture up to 10,214 tons of carbon dioxide (“CO2”) from the atmosphere via Enhanced Rock Weathering (“ERW”).[1] The potential net amount of carbon captured is estimated at 7,106 tons of CO2. In addition to its carbon removal potential, Q3 2025 sales avoided the emissions of 4,155 tons of CO2e, by substituting potassium chloride (“KCl”) fertilizers.[2] Combining the potential carbon removal and carbon emissions avoided by the use of the product since the start of production in 2018, Verde’s total potential impact stands at 329,933 tons of CO2.[3]
- 6,740 tons of chloride have been prevented from being applied into soils in Q3 2025, by farmers who used the Product in lieu of KCl fertilizers.[4] A total of 188,742 tons of chloride has been prevented from being applied into soil by Verde’s customers since the Company started production.[5]
Recent Events
- Subsequent to quarter end, Verde announced the discovery of a continuous, clay-hosted rare earth element mineralized zone in Minas Gerais, Brazil, covering approximately 5,500 hectares across 13 mineral rights. The zone was defined through integrated geological mapping, geochemistry, and spectral or geophysical datasets, and confirmed by trench sampling (see news release dated October 6, 2025). The commencement of a three-rig drilling program, was announced shortly after this discovery, which focuses on defining initial high-quality magnet rare earths resources (see news release dated October 9, 2025).
- In addition, Verde’s Board has reviewed the initial trench sampling work and has decided to accelerate the project, now formally named the Minas Americas Global Alliance magnetic rare earths project (the “Project”), laying out key project milestones (see news release dated October 21, 2025), which includes: completing mobilization; confirming ionic clay mineralization with summary of ionic adsorption diagnostics together with full leachate impurity and radiological screening, completing initial drilling and additional trenching (Q4 2025), releasing results from an ANSTO recovery test (Q1 2026); publishing a maiden NI 43-101 mineral resource estimate (Q1 2026) and publishing a preliminary economic assessment (PEA) (mid-2026). Verde is fully funded to execute the initial Project work program while continuing its fertilizer operations.
- More recently, Verde confirmed ionic-adsorption behaviour across multiple trenches at the Minas Americas Global Alliance Project reporting that ammonium-sulfate leach tests returned primary leach solutions (“PLS”) with very strong magnet rare earth (neodymium (Nd), praseodymium (Pr), dysprosium (Dy), terbium (Tb)) grades and exceptionally low impurities (thorium/ uranium (Th/U) at, or below, detection) (see news release dated October 21, 2025).
“Despite the Great Brazilian Agricultural Crisis that began in early 2023 amidst a backdrop of tight credit and higher rates, our team delivered Verde’s first positive EBITDA after eight consecutive negative quarters and we are cautiously optimistic that this momentum will continue into 2026,” continued Mr. Veloso. “We have grown our sales volumes at a 6-year CAGR of 49%, and that discipline—protecting cash generation and finishing Q3 with $3.6 million—positions us well. Looking ahead, we expect Q4 2025 into Q1 2026 to be stronger than the past year, signaling a potential end to the Brazilian agricultural crisis and a return to growth.”
Q3 2025 In Review
Market Analysis
Agricultural and fertilizer sector
The agribusiness sector continued to face pressure during Q3 2025 as part of the Great Brazilian Agricultural Crisis, with ongoing challenges such as geopolitical tensions, extreme climate risks, high input costs, financing difficulties and trade volatility, creating uncertainties for output and market stability.[6] However, Verde began to see some recovery from the agricultural downturn that started in early 2023. The Companhia Nacional de Abastecimento (Conab) September report expects Brazilian’s soybean, corn and grain production to remain high, reaffirming the country’s resilience in agricultural output. Brazilian farmers have begun the 2025/26 planting season, and Conab’s initial outlook suggests another increase in corn and soybean acreage. The expansion reflects rising domestic biofuel demand and robust exports that continue to set shipment records.[7] At the same time, global demand for potash is strengthening, supported by population growth, food security, precision farming, specialized fertilizers, and a focus on efficiency. The market is projected to reach US$34.8 billion by 2033, suggesting a 9-year CAGR of 2.66%.[8] Taken together with projected 5-year and 10-year growth rates of ~2.3-2.5% per year and 2.5% per year, respectively, suggests a cautiously optimistic outlook for the sector.[9]
Despite this, input cost challenges, particularly high fertilizer prices, combined with relatively steady crop prices, have impacted the profitability of Brazil’s soy and corn producers during the 2025/26 harvest, currently being planted.[10] During the quarter, fertilizer prices, especially for potassium chloride (KCI), remained high, above US$350/metric ton. [11] This may lower the gross margins for producers even amid strong demand for grains and other agricultural products. [12]
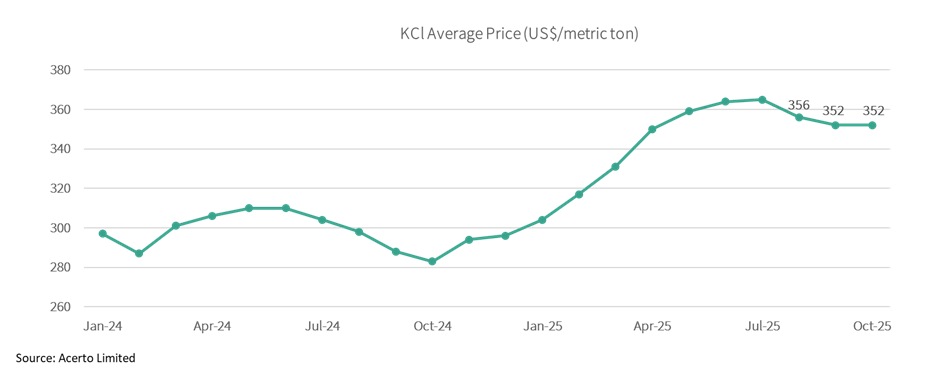
Figure 1: Average potassium chloride (KCl) prices per metric ton
Brazilian farmers relying on leased land or loans face further challenges from high interest rates and accumulated leverage. According to Experian’s Agro Judicial Recovery Indicator, the sector registered 565 requests for judicial measures in Q2 2025, up 31.7% from the previous quarter.[13]
The government recently announced a R$12.0 billion (approximately USD 2.21 billion) rural credit and debt-relief program aimed at supporting up to 100,000 mostly small and medium farmers, affected by extreme weather. [14] While the initiative is designed to ease short-term cash flow pressures, reduce credit risk, and support input demand (including fertilizers), many farmers are finding it difficult to access the funds. Banks responsible for intermediating the operations require substantial collateral, but most farmers have already pledged their available assets to other creditors.
Like Verde, other players in the sector adopted measures to safeguard operations and improve resilience. Fertilizer producers face a combination of climate-related delays, lower technology adoption, and farmer cost containment. Many have launched debt restructuring efforts to reduce short-term liabilities, preserve liquidity, and secure more sustainable financial terms on existing debt.[15] These actions reinforce a sector-wide emphasis on cost discipline, credit selectivity, and long-term stability. Verde maintained a conservative commercial strategy throughout the quarter, limiting sales exposure to higher-risk clients.
Rare earths market
The price for rare earths elements remained elevated in Q3 2025. Despite China implementing stricter export controls on rare earth elements and related technologies, citing national security concerns[16], the global market continues to grow, with projections showing a 7-year CAGR of 10.2%, from US$3.74 billion in 2024 to US$8.14 billion by 2032.[17] Brazil, which holds the world’s second-largest, rare earths reserves at 21 million metric tons[18], is taking steps to strengthen its position, offering financial guarantees and tax incentives to support domestic mining and processing of strategic minerals.[19] Driven by rising global demand for strategic minerals, investments in Brazil’s rare earths sector are forecast to climb 49% by 2029.[20]
Macroeconomic Conditions
Under a tight monetary policy, with record-high SELIC interest rates of 15%, Brazil’s economy is expected to have grown by around 0.3% in the quarter,[21] with a full-year growth projected by Brazilian Central Bank at 2.0%.[22] While the SELIC rate remains elevated, there may be an interest rate cut if inflation continues to ease. Current forecasts indicate the rate will gradually decline to 12.25% in 2026 and further to 10% by 2028. Inflation forecasts for 2025 and 2026 stand at 4.80% and 3.60%[23], respectively, suggesting a cautiously optimistic outlook that Brazil’s macroeconomic environment may be on a path toward stabilization in the medium term.
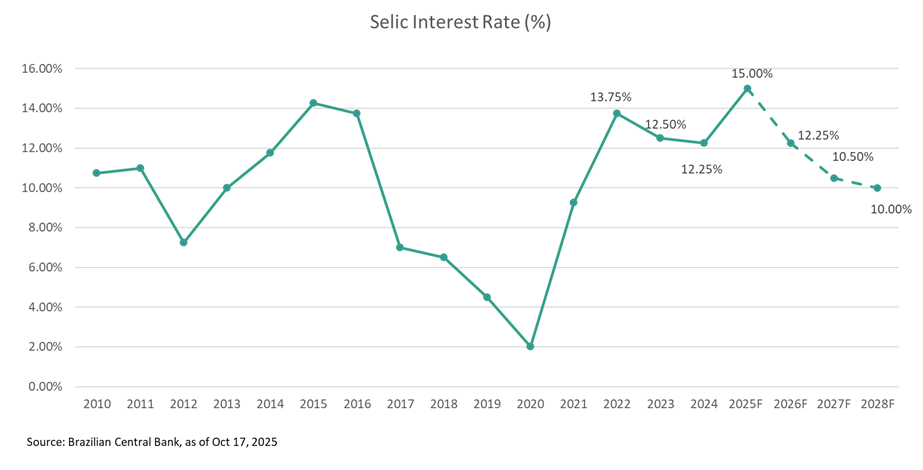
Figure 2: Selic Interest Rates
The agriculture industry continues to navigate an increasingly challenging credit environment. Working capital remains tight for many farmers, and more suppliers have shifted toward post-harvest payment terms, often requiring payment nine to 12 months after the harvest. As discussed earlier, a government subsidy introduced earlier this year aims to ease short-term credit constraints. In reality, however, many farmers still struggle to access these funds, as banks are requiring collateral that they often cannot provide, and available guarantees remain limited. As a result, credit approvals and disbursements continue to lag, forcing farmers and producers to carefully manage liquidity, cash flow and credit exposure throughout the supply chain.
Global political developments involving key Brazilian trading partners, along with ongoing discussions around taxation and regulation, have introduced some uncertainty for farmers considering long-term investments. In response, many are taking a more conservative approach, prioritizing essential inputs and maintaining financial discipline. While this cautious sentiment has moderated short-term fertilizer demand, it also reflects a broader focus on operational efficiency and strategic resource allocation. As greater clarity emerges around policy and market dynamics, purchasing activity may begin to recover.[24]
External Factors
Revenue and costs are affected by external factors including changes in the exchange rates between the C$ and R$ along with fluctuations in potassium chloride spot CFR Brazil, agricultural commodities prices, interest rates, among other factors. For further details, please refer to the Q3 2025 Year in Review section.
Results of Operations
The following table provides information about three months ended September 30, 2025, as compared to the three months ended September 30, 2024. All amounts in CAD $’000.
|
3 months
ended
Sep 30, 2025 |
3 months ended
Sep 30, 2024 |
9 months ended
Sep 30, 2025 |
9 months
ended
Sep 30, 2024 |
| Tons sold ‘000 |
85 |
101 |
213 |
271 |
| Average Revenue per ton sold $$ |
69 |
71 |
63 |
69 |
| Average Production cost per ton sold $ |
(17) |
(18) |
(17) |
(20) |
| Average Gross Profit per ton sold $ s |
52 |
53 |
46 |
49 |
| Gross Margin |
75% |
75% |
73% |
71% |
| |
|
|
|
|
| Revenue |
5,873 |
7,161 |
13,525 |
18,709 |
| Production costs(1) |
(1,447) |
(1,830) |
(3,520) |
(5,316) |
| Gross Profit |
4,426 |
5,331 |
10,005 |
13,393 |
| Gross Margin |
75% |
75% |
73% |
71% |
| Sales and marketing expenses |
(907) |
(895) |
(2,649) |
(2,844) |
| Product delivery freight expenses |
(2,301) |
(2,630) |
(5,149) |
(6,767) |
| General and administrative expenses |
(955) |
(1,054) |
(3,053) |
(3,467) |
| Allowance for expected credit losses |
(163) |
(785) |
(670) |
(1,018) |
| EBITDA (2) |
100 |
(33) |
(1,516) |
(703) |
| Share Based and Bonus Payments (Non-Cash Event)(3) |
8 |
(104) |
(225) |
(2,146) |
| Depreciation, Amortisation and P/L on disposal of plant and equipment (3) |
(798) |
(758) |
(2,344) |
(2,479) |
| Operating Profit after non-cash events |
(690) |
(895) |
(4,085) |
(5,328) |
| Interest Income/Expense (4) |
(1,389) |
(1,431) |
(4,191) |
(4,372) |
| Net Profit before tax |
(2,079) |
(2,326) |
(8,276) |
(9,700) |
| Income tax (5) |
(7) |
(10) |
(17) |
(27) |
| Net Profit |
(2,086) |
(2,336) |
(8,293) |
(9,727) |
|
|
|
|
|
|
(1) – Non GAAP measure
(2) – Included in General and Administrative expenses in financial statements
(3) – Included in General and Administrative expenses and Cost of Sales in financial statements
(4) – Please see Summary of Interest-Bearing Loans and Borrowings notes
(5) – Please see Income Tax notes
Operating and Financial Results
Sales Performance
In Q3 2025, revenue from sales declined by 18%, accompanied by a 3% decline in the average revenue per ton compared to Q3 2024. Excluding freight expenses (FOB price), the average revenue per ton declined by 6%, primarily driven by the devaluation of the Brazilian Real by 5.1% and a reduction in sales of specialty products, which decreased from 17% to 15% of the sales mix. The shift reflects farmers’ increasing preference for lower value-added products, as many continue to face restricted cash flows.
Verde maintains a rigorous credit approval process for customers purchasing specialty fertilizers, due to the inclusion of third-party raw materials in these products. This more stringent evaluation helps safeguard operational continuity and mitigates risks associated with the fulfillment of purchase agreements.
The Company reported a net loss of $2.1 million in Q3 2025, compared to a net loss of $2.3 million in Q3 2024. The year-over-year improvement of $0.2 million primarily reflects lower non-cash expense from a reduction in the allowance for expected credit losses
Basic loss per share totaled $0.04 in Q3 2025, the same as in Q3 2024.
Production Costs [25]
The average cost per ton decreased by 6% in Q3 2025, primarily due to an 5.1% devaluation of the Brazilian Real, alongside a lower proportion of specialty product orders compared to regular products.
Production costs include all direct costs from mining, processing, and the addition of other nutrients to the Product, such as sulphur and boron. It also includes the logistics costs from the mine to the plant and related salaries.
Financing Activities
As a result of Q2 2025 debt restructuring, the Company required less cash for interest and principal payments during the period.
| Loans
CAD $’000 |
Before renegotiation |
After renegotiation |
| Short-term loans |
43,316 |
3,458 |
| Long-term loans |
7,562 |
45,484 |
| Total |
50,878 |
48,942 |
Financial Position
As of September 30, 2025, Verde held cash of $3.6 million, compared to $3.4 million at the end of Q3 2024. Short-term receivables recorded during the quarter were $7.9 million. The total cash and short-term receivables were $11.5 million in Q3 2025.
Outlook
For the balance of 2025 and into 2026, the Company expects continued operational improvement in its fertilizer business versus the prior 24 months. Verde anticipates improving market conditions, with early signs of recovery in H2 2025—supported by higher grain output, the potential for lower Brazilian interest rates, and moderating inflation—pointing to a near-term easing of the agricultural downturn.
Following the discovery of high-grade magnet rare earth mineralization at the Minas Americas Global Alliance magnetic rare earths project, the Board has initiated a strategic review and outlined several key project milestones which include: confirming ionic clay mineralization with summary of ionic adsorption diagnostics together with full leachate impurity and radiological screening (now confirmed), completing initial drilling and additional trenching (Q4 2025), releasing results from an ANSTO recovery test (Q1 2026); publishing a maiden NI 43-101 mineral resource estimate (Q1 2026) and publishing a preliminary economic assessment (PEA) (mid-2026).
Q3 Results Conference Call
The Company will host a conference call to discuss Q3 2025 results and provide an update. Subscribe using the link below and receive the conference details by email.
The Company’s financial statements and related notes for the period ended September 30, 2025 are available to the public on SEDAR+ at www.sedarplus.ca and the Company’s website at www.investor.verde.ag/.
About Verde AgriTech
Verde AgriTech is dedicated to advancing sustainable agriculture through the innovation of specialty multi-nutrient potassium fertilizers. Our mission is to increase agricultural productivity, enhance soil health, and significantly contribute to environmental sustainability. Utilizing our unique position in Brazil, we harness proprietary technologies to develop solutions that not only meet the immediate needs of farmers but also address global challenges such as food security and climate change. Our commitment to carbon capture and the production of eco-friendly fertilizers underscores our vision for a future where agriculture contributes positively to the health of our planet.
For more information on how we are leading the way towards sustainable agriculture and climate change mitigation in Brazil, visit our website at https://verde.ag/en/home/.
For additional information please contact:
Cristiano Veloso, Chief Executive Officer and Founder
Tel: +55 (31) 3245 0205; Email: investor@verde.ag
www.verde.ag | www.investor.verde.ag
Cautionary Language and Forward-Looking Statements
Cautionary Note Regarding Mineral Resources and Reserves (NI 43-101 / CIM)
Unless otherwise indicated, all scientific and technical information in this news release has been prepared in accordance with National Instrument 43-101 – Standards of Disclosure for Mineral Projects (“NI 43-101”) and the Canadian Institute of Mining, Metallurgy and Petroleum (“CIM”) Definition Standards (May 10, 2014). Mineral Resources that are not Mineral Reserves do not have demonstrated economic viability. Inferred Mineral Resources are considered too speculative geologically to have economic considerations applied to them that would enable them to be categorized as Mineral Reserves, and there is no certainty that any part of an Inferred Mineral Resource will be converted into Measured or Indicated Mineral Resources or into Mineral Reserves. The results of any preliminary economic assessment (“PEA”) or pre-feasibility study (“PFS”), to the extent referenced, are preliminary in nature and include inferred Mineral Resources that are considered too speculative geologically to have economic considerations applied to them that would enable them to be categorized as Mineral Reserves; there is no certainty that the PEA or PFS results will be realized.
Cautionary Note to U.S. Investors
The terms “Mineral Resource,” “Inferred Mineral Resource,” “Indicated Mineral Resource,” and “Measured Mineral Resource,” and “Mineral Reserve,” as used herein, are defined in accordance with NI 43-101 and the CIM Definition Standards, which differ in certain respects from the requirements of the U.S. Securities and Exchange Commission (“SEC”), including Subpart 1300 of Regulation S-K (“S-K 1300”). Accordingly, information contained herein may not be comparable to similar information made public by U.S. companies subject to the SEC’s reporting and disclosure requirements.
Forward-Looking Information and Forward-Looking Statements
This news release contains “forward-looking information” within the meaning of applicable Canadian securities laws and “forward-looking statements” within the meaning of the United States Private Securities Litigation Reform Act of 1995 (collectively, “forward-looking statements”). Forward-looking statements are made as of the date of this news release and relate to future events or performance. Often, but not always, forward-looking statements can be identified by words such as “expects,” “anticipates,” “plans,” “projects,” “estimates,” “envisages,” “assumes,” “intends,” “strategy,” “goals,” “objectives,” or variations (including negative variations) of such words and phrases, or statements that certain actions, events or results “may,” “could,” “would,” “might,” or “will” be taken, occur or be achieved.
Forward-looking statements in this news release include, without limitation, statements with respect to: (i) estimates of the tonnage and grades of Mineral Resources and Mineral Reserves; (ii) the potential amount of CO₂ removal per tonne of rock and the development, verification, issuance and sale of carbon-removal credits; (iii) the PFS representing a viable development option for the Project and the timing of related disclosures; (iv) estimates of initial and sustaining capital costs, operating and total costs, payback periods, net cash flow, net present value and economic returns; (v) future production volumes (produced and sold) and sales assumptions for Super Greensand® and K Forte®; (vi) the Company’s competitive position in Brazil and potash market demand; (vii) recommendations of any special committee; (viii) the terms, timing, court approval and financial impact of any debt restructuring; and (ix) the potential outcomes of re-assaying certain core samples.
These forward-looking statements are based on the Company’s and its consultants’ reasonable assumptions, estimates and opinions as of the date hereof, including, without limitation: (i) the presence and continuity of Mineral Resources and Mineral Reserves at estimated grades; (ii) geotechnical, hydrological and metallurgical characteristics of rock consistent with sampled results; (iii) capacities, availability and performance of equipment and personnel at estimated costs and timelines; (iv) foreign exchange rates; (v) realized sales prices, market size and adoption for the Company’s products; (vi) applicable discount, tax and royalty rates; (vii) availability and cost of acceptable financing; (viii) anticipated mining loss and dilution; (ix) receipt of required permits and other regulatory approvals on acceptable terms; (x) reasonable contingency allowances; (xi) successful execution of operating plans; (xii) the fulfilment of environmental assessment commitments and community arrangements; and (xiii) for carbon-removal activities, the applicability of methodologies, verification, permanence, monitoring and market acceptance.
Forward-looking statements are inherently subject to known and unknown risks, uncertainties and other factors that may cause actual results to differ materially from those expressed or implied. Such risks and uncertainties include, without limitation: risks related to court approvals and the completion of any debt restructuring; variations in grade or recovery; adverse geotechnical, hydrological or metallurgical conditions; changes in project parameters as plans continue to be refined; cost escalation and inflationary pressures; labour availability; fluctuations in commodity prices and demand (including potash); foreign-exchange volatility (including Brazilian Real–Canadian dollar); availability and terms of financing; changes in tax and royalty regimes; delays in permitting or stakeholder agreements; competitive pressures; infrastructure and operational risks; regulatory changes affecting mining, fertilizers and carbon-removal markets; and, for carbon-removal activities, risks relating to methodology eligibility, additionality, durability/permanence, leakage, monitoring, verification, certification, policy shifts and pricing, any of which could affect the issuance, saleability or value of credits. Additional information about risk factors is described in the Company’s most recent Annual Information Form filed on SEDAR+ (www.sedarplus.com) and in other continuous disclosure filings. The foregoing list is not exhaustive, and there can be no assurance that forward-looking statements will prove accurate.
Readers are cautioned not to place undue reliance on forward-looking statements. Except as required by applicable law, the Company disclaims any intention or obligation to update or revise any forward-looking statements, whether as a result of new information, future events or otherwise.
Financial Outlook / Future-Oriented Financial Information
This news release may contain future-oriented financial information or financial outlooks (collectively, “FOFI”) within the meaning of applicable securities laws, including, without limitation, estimates of capital and operating costs, net present value, internal rate of return, payback and projected revenues or cash flows. Such FOFI are provided to describe the anticipated effects of proposed project development and may not be appropriate for other purposes. The FOFI are based on the assumptions and subject to the risks described above, and actual results may vary materially.
Currency, Units and Trademarks
Unless otherwise stated, all figures are in Canadian dollars (C$). Tonnages are metric tonnes. Super Greensand® and K Forte® are registered trademarks of the Company.
[1] The carbon capture potential of Verde’s products, through Enhanced Rock Weathering (ERW), is 120 kg CO2e per ton of K Forte®. For further information, see “Verde’s Products Remove Carbon Dioxide From the Air”.
[2] K Forte® is a fertilizer produced in Brazil using national raw materials. Its production process has low energy consumption from renewable sources and, consequently, a low environmental and GHG emissions footprint. Whereas the high carbon footprint of KCl results from a complex production process, involving extraction, concentration, and granulation of KCl, in addition to the long transportation distances to Brazil, given that 95% of the KCl consumed in the country is imported. 12Mt of K Forte® is equivalent to 2Mt of KCl in K2O content. Emissions avoided are calculated as the difference between the weighted average emissions for KCl suppliers to produce, deliver, and apply their product in each customer’s city and the emissions determined according to K Forte®’s Life Cycle Assessment for its production, delivery, and application in each customer’s city.
[3] From 2018 to Q3 2025, the Company has sold 2.4 million tons of Product, which can potentially remove up to 261,948 tons of CO2. Additionally, this amount of Product could potentially avoid up to 67,985 tons of CO2 emissions.
[4] Verde’s Product is a salinity and chloride-free replacement for KCl fertilizers. Potassium chloride is composed of approximately 46% of chloride, which can have biocidal effects when excessively applied to soils. According to Heide Hermary (Effects of some synthetic fertilizers on the soil ecosystem, 2007), applying 1 pound of potassium chloride to the soil is equivalent to applying 1 gallon of Clorox bleach, with regard to killing soil microorganisms. Soil microorganisms play a crucial role in agriculture by capturing and storing carbon in the soil, making a significant contribution to the global fight against climate change.
[5] 1 ton of Product (10% K2O) has 0.1 tons of K2O, which is equivalent to 0.17 tons of potassium chloride (60% K2O), containing 0.08 tons of chloride.
[6] Source: Perspectives for Agriculture – Volume 13 – 2025/2026 Harvest, Companhia Nacional de Abasteciento, September 19, 2025. Available at: https://www.gov.br/conab/pt-br/acesso-a-informacao/institucional/publicacoes/perspectivas-para-a-agropecuaria/perspectivas-para-a-agropecuaria-volume-13-safra-2025-2026-1
[7] Source: Brazil begins planting with expected record acreage driven by high demand but low margins, Farmdoc Daily, University of Illinois at Urbana-Champaign, October 20, 2025. Available at: https://farmdocdaily.illinois.edu/2025/10/brazil-begins-planting-with-expected-record-acreage-driven-by-high-demand-but-low-margins.html
[8] Source: Potash Market Report – Business Research Insights, October 20, 2025. Available at: https://www.businessresearchinsights.com/market-reports/potash-market-120921
[9] Source: Brazil: 2025 article iv consultation—press release; staff report; and statement by the executive director for Brazil, International Monetary Fund, June 27, 2025. Available at: https://www.elibrary.imf.org/view/journals/002/2025/194/article-A000-en.pdf
10 Source: Soy and corn farmers could face losses this harvest, Valor International, October 17, 2025. Available at: https://valorinternational.globo.com/agribusiness/news/2025/10/17/soy-and-corn-farmers-could-face-losses-this-harvest.ghtml
[11] Available at: Acerto Limited
[12] Source: Brazil begins planting with expected record acreage driven by high demand but low margins, Farmdoc Daily, University of Illinois at Urbana-Champaign, October 20, 2025. Available at: https://farmdocdaily.illinois.edu/2025/10/brazil-begins-planting-with-expected-record-acreage-driven-by-high-demand-but-low-margins.html
[13] Source: Judicial Reorganization: requests grow almost 32% in agribusiness in the second quarter of 2025, shows Serasa Experian indicator, Serasa Experian, September 29, 2025. Available at: https://www.serasaexperian.com.br/sala-de-imprensa/agronegocios/recuperacao-judicial-solicitacoes-crescem-quase-32-no-agro-em-segundo-trimestre-de-2025-mostra-indicador-da-serasa-experian/
[14] Source: Brazil’s Lula announces $2.2 bln debt relief package for farmers, Reuters, September 5, 2025. Available at: https://www.reuters.com/business/finance/brazils-lula-announces-22-bln-debt-relief-package-farmers-2025-09-05/
[15] Source: Lavoro Restructures $460 Million Debt to Secure Crop Input Supply, The AgriBiz, June 18, 2025. Available at: https://www.theagribiz.com/international/lavoro-restructures-460-million-debt-to-secure-crop-input-supply/
[16] Source: Concerned carmakers race to beat China’s rare earths deadline, Reuters, October 21, 2025. Available at: https://www.reuters.com/business/autos-transportation/concerned-carmakers-race-beat-chinas-rare-earths-deadline-2025-10-21/
[17] Source: Rare Earth Elements Market Size, Share & Industry Analysis and Regional Forecast, 2024-2032, Fortune Business Insights, October 6, 2025. Available at: https://www.fortunebusinessinsights.com/rare-earth-elements-market-102943
[18] Source: Brazil’s rare earth projects seek partnerships to enhance energy security, S&P Global, June 6, 2025. Available at: https://www.spglobal.com/commodity-insights/en/news-research/latest-news/metals/060625-brazils-rare-earth-projects-seek-partnerships-to-enhance-energy-security
[19] Source: Brazil eyes financial guarantees, tax breaks for strategic minerals, Reuters, September 5, 2025. Available at: https://www.reuters.com/business/brazil-eyes-financial-guarantees-tax-breaks-strategic-minerals-2025-10-16/
[20] Source: Brazilian Rare earth investments to rise 49% by 2029, Agencia Brazil, October 22, 2025. Available at: https://agenciabrasil.ebc.com.br/en/economia/noticia/2025-10/brazilian-rare-earth-investments-rise-49-2029
[21] Source: Brazil’s economy slows sharply in second quarter but still beats forecasts, Reuters, September 2, 2025. Available at: https://www.reuters.com/world/americas/brazils-economy-slows-sharply-second-quarter-still-beats-forecasts-2025-09-02/
[22] Source: Brazilian Central Bank, Projections for GDP growth in 2025 and 2026, September 2025. Report. Available at: https://www.bcb.gov.br/content/ri/inflationreport/202509/rpm202509b1i.pdf
[23] As of September 30, 2025. Source: Brazilian Central Bank
[24] Source: “US sanctions could cause chaos on Latam farms run on Russian fertilizers,” Reuters, July 21, 2025. Available at: https://www.reuters.com/world/americas/us-sanctions-could-cause-chaos-latam-farms-run-russian-fertilizers-2025-07-21
[25] Verde’s production costs and sales price are based on the following assumptions:
- Micronutrients added to the product increase its production cost, rendering K Forte® less expensive to produce.
- Production costs vary based on packaging type, with bulk being less expensive than Jumbo Bags.
- Plant 1 produces K Forte® Jumbo Bags and Low-Carbon Specialty Fertilizer Products, while Plant 2 exclusively produces K Forte® Bulk. Therefore, Plant 2’s production costs are lower than Plant 1’s costs.
Singapore. August 07, 2025. — Verde AgriTech Ltd (TSX: “NPK”) (“Verde” or the “Company”) announces its financial results for the period ended June 30, 2025 (“Q2 2025”). All figures are in Canadian dollars, unless stated otherwise. Average exchange rate in Q2 2025: C$1.00 = R$4.08.
Q2 2025 Highlights
Operational and Financial Highlights
- Verde’s sales volume in Q2 2025 was 80,354 tons; a 6% reduction compared to Q2 2024, which generated $4.8 million in revenue during the quarter.
- Gross margin excluding freight was 58% during the quarter, compared to Q2 2024 gross margin of 55%.
- Sales and Marketing expenses in Q2 2025 were -$0.9 million, compared to -$1.0 million in Q2 2024.
- Positive operating cash inflow of $0.2 million was recorded during the quarter, compared to -$0.3 million cash outflow in Q2 2024.
- EBITDA before non-cash events was -$0.2 million in Q2 2025, compared to nil in Q2 2024.
- Net loss in Q2 2025 was -$2.4 million, compared to a -$2.6 million loss in Q2 2024.
- Cash of $2.4 million in Q2 2025 compared to $2.7 million in Q2 2024. Short-term receivables in the quarter were $8.2 million compared to $12.8 million in Q2 2024.
- The Company successfully completed the renegotiation of short-term and long-term loans in Q2 2025, with approximately 99.5% of loans classified as long-term versus 19.8% prior to the renegotiation. Short-term loans totaled $0.2 million in the quarter, compared to $22.9 million in Q2 2024.
Sustainability Highlights
- Product sold in Q2 2025 has the potential to capture up to 9,640 tons of carbon dioxide (“CO2”) from the atmosphere via Enhanced Rock Weathering (“ERW”).[1] The potential net amount of carbon captured is estimated at 6,890 tons of CO2. In addition to the carbon removal potential, Q2 2025 sales avoided the emissions of 4,102 tons of CO2e, by substituting potassium chloride (“KCl”) fertilizers.[2] Combining the potential carbon removal and carbon emissions avoided by the use of the product since the start of production in 2018, Verde’s total potential impact stands at 315,564 tons of CO2.[3]
- 6,368 tons of chloride have been prevented from being applied into soils in Q2 2025, by farmers who used the Product in lieu of KCl fertilizers.[4] A total of 182,002 tons of chloride has been prevented from being applied into soil by Verde’s customers since the Company started production.[5]
“Against a backdrop of tight credit and elevated interest rates, our team delivered a resilient second quarter,” said Cristiano Veloso, Founder and Chief Executive Officer of Verde AgriTech. “By renegotiating more than 99 per cent of our debt into long‑term maturities, cutting unit production costs, and preserving a best‑in‑class 58 per cent gross margin (ex‑freight), we have fortified the balance sheet and protected cash flow while Brazil’s farm economy cycles through unprecedented volatility.”
“At the same time, every ton we sold in Q2 puts money back in growers’ pockets and carbon back in the ground. Since first production, our products have the potential to remove or avoid over 315,000 tons of CO₂ and have kept 182,000 tons of chloride out of Brazilian soils. That double dividend—higher crop productivity and climate impact—continues to differentiate Verde in the fertilizer market.”
“Looking ahead to the second half, our presence in core regions, launching tailored multi‑nutrient formulations. These priorities position Verde to capture the upside when sector demand rebounds, while creating enduring value for our customers, communities and shareholders.”
Q2 2025 In Review
Market Analysis
In Q2 2025, Brazil’s agricultural input sector continued to navigate the lingering effects of a prolonged downturn that began in 2022. High indebtedness among farmers and distributors, combined with limited access to credit and adverse market dynamics, led to cautious purchasing behavior. Many agribusinesses remain engaged in debt renegotiation processes — either judicial or informal — while suppliers across the chain have tightened credit policies and prioritized liquidity.[6]
Despite this challenging backdrop, certain indicators signaled a possible shift in market dynamics. Potash prices, particularly for potassium chloride (KCl), remained stable and showed a modest upward trend throughout the quarter.[7]
Like Verde, other players in the sector adopted measures to safeguard operations and improve resilience. Companies face a combination of climate-related delays, lower technology adoption, and farmer cost containment. Many have launched debt restructuring efforts to reduce short-term liabilities, preserve liquidity, and secure more sustainable financial terms.[8] These actions reinforce a sector-wide emphasis on cost discipline, credit selectivity, and long-term stability. Verde maintained a conservative commercial strategy throughout the quarter, limiting sales exposure to higher-risk clients.
Macroeconomic Conditions
The macroeconomic environment in Brazil remained restrictive during Q2 2025. The SELIC rate stood at 15.00% at the end of the quarter and remained unchanged in the following month[9]— still among the highest real interest rates globally. These financing conditions continue to constrain credit availability for rural producers and delay investments in agricultural inputs. Projections suggest that the SELIC will remain at current levels through the end of 2025[10], while JP Morgan foresees it to gradually decrease to 10.75% by the end of 2026.[11]
Inflation forecasts for 2025 and 2026 stand at 5.10% and 4.40%[12], respectively, suggesting a cautiously optimistic outlook that Brazil’s macroeconomic environment may be on a path toward stabilization in the medium term. Although working capital remains tight for many farmers, especially during the critical period for purchasing inputs such as fertilizers, the industry has adapted by shifting payment terms to post-harvest settlements, typically between 9 and 12 months. This practice, while standard in the agricultural sector, requires careful management of cash flow and credit exposure across the supply chain.
Global political developments involving key Brazilian trading partners, along with ongoing discussions around taxation and regulation, have introduced some uncertainty for farmers considering long-term investments. In response, many are taking a more conservative approach, prioritizing essential inputs and maintaining financial discipline. While this cautious sentiment has moderated short-term fertilizer demand, it also reflects a broader focus on operational efficiency and strategic resource allocation. As greater clarity emerges around policy and market dynamics, purchasing activity may begin to recover.[13]
External Factors
Revenue and costs are affected by external factors including changes in the exchange rates between the C$ and R$ along with fluctuations in potassium chloride spot CFR Brazil, agricultural commodities prices, interest rates, among other factors. For further details, please refer to the Q2 2025 Year in Review section.
Results of Operations
The following table provides information about three months ended June 30, 2025, as compared to the three months ended June 30, 2024. All amounts in CAD $’000.
| All amounts in CAD $’000 |
3 months ended
Jun 30, 2025 |
3 months ended
Jun 30, 2024 |
6 months ended
Jun 30, 2025 |
6 months ended
Jun 30, 2024 |
| Tons sold ‘000 |
80 |
85 |
128 |
170 |
| Average Revenue per ton sold $$ |
60 |
76 |
60 |
68 |
| Average Production cost per ton sold $ |
(16) |
(21) |
(16) |
(21) |
| Average Gross Profit per ton sold $ s |
44 |
55 |
44 |
47 |
| Gross Margin |
73% |
72% |
73% |
70% |
| |
|
|
|
|
| Revenue |
4,800 |
6,480 |
7,652 |
11,548 |
| Production costs(1) |
(1,316) |
(1,815) |
(2,073) |
(3,486) |
| Gross Profit |
3,484 |
4,665 |
5,579 |
8,062 |
| Gross Margin |
73% |
72% |
73% |
70% |
| Sales and marketing expenses |
(891) |
(979) |
(1,742) |
(1,949) |
| Product delivery freight expenses |
(1,733) |
(2,541) |
(2,848) |
(4,137) |
| General and administrative expenses |
(1,048) |
(1,058) |
(2,098) |
(2,414) |
| Allowance for expected credit losses |
6 |
(87) |
(507) |
(232) |
| EBITDA (2) |
(182) |
– |
(1,616) |
(670) |
| Share Based and Bonus Payments (Non-Cash Event)(3) |
(72) |
(265) |
(233) |
(2,042) |
| Depreciation, Amortisation and P/L on disposal of plant and equipment (3) |
(772) |
(802) |
(1,546) |
(1,721) |
| Operating Profit after non-cash events |
(1,026) |
(1,067) |
(3,395) |
(4,433) |
| Interest Income/Expense (4) |
(1,394) |
(1,564) |
(2,802) |
(2,941) |
| Net Profit before tax |
(2,420) |
(2,631) |
(6,197) |
(7,374) |
| Income tax (5) |
(6) |
(8) |
(10) |
(17) |
| Net Profit |
(2,426) |
(2,639) |
(6,207) |
(7,391) |
(1) – Non GAAP measure
(2) – Included in General and Administrative expenses in financial statements
(3) – Included in General and Administrative expenses and Cost of Sales in financial statements
(4) – Please see Summary of Interest-Bearing Loans and Borrowings notes
(5) – Please see Income Tax notes
Operating and Financial Results
Sales Performance
In Q2 2025, revenue from sales declined by 6%, accompanied by a 21% decrease in the average revenue per ton compared to Q2 2024. Excluding freight expenses (FOB price), the average revenue per ton fell by 17%, primarily driven by the devaluation of the Brazilian Real by 9.2% and a reduction in sales of specialty products, which decreased from 18% to 9% of the sales mix. The shift reflects farmers’ increasing preference for lower value-added products, as many continue to face restricted cash flows.
Verde maintains a rigorous credit approval process for customers purchasing specialty fertilizers, due to the inclusion of third-party raw materials in these products. This more stringent evaluation helps safeguard operational continuity and mitigates risks associated with the fulfillment of purchase agreements.
The Company reported a net loss of -$2.4 million in Q2 2025, compared to a net loss of -$2.6 million in Q2 2024. The result was primarily impacted by interest expenses of -$1.4 million and depreciation of -$0.8 million. The year-over-year improvement of $0.2 million was mainly due to a reduction in non-cash expenses related to stock options granted by the Company, when compared to the same period in the previous year.
Basic loss per share was -$0.04 for Q2 2025, compared to a basic loss per share of -$0.05 for Q2 2024.
Production Costs[14]
The average cost per ton decreased by 24% in Q2 2025, primarily due to renegotiated supplier contracts, a reduction in operational headcount, and an 9.2% devaluation of the Brazilian Real, alongside a lower proportion of specialty product orders compared to regular products.
Production costs include all direct costs from mining, processing, and the addition of other nutrients to the Product, such as sulphur and boron. It also includes the logistics costs from the mine to the plant and related salaries.
Verde’s continued focus on cost reduction has allowed the company to maintain existing gross margins despite inflationary pressures, customer credit restrictions, and commodity price fluctuations.
Loan Renegotiation
Verde’s debt restructuring — renegotiated with over 97.5% of its creditors — has significantly reduced its short-term obligations. Among total debt, 92.2% were classified as debt owed to adherent creditors and 5.3% as debt owed to non-adherent creditors.
Although debt owed to non-adherent creditors only comprised a small portion of total debt, the Company experienced a significant reduction in the principal owed to this group (75%), equating to approximately R$7.0 million. The interest rate on this category of debt was also significantly reduced to the Taxa Referencial (TR)[15], currently around 1.36% per year. The grace period and repayment term for debt associated with non-adherent creditors are 19 months on both principal and interest (starting from the court-approved debt renegotiation date of April 2025) and 108 months following the grace period, respectively.
The terms applied to the majority (92.2%) of total debt, owed to adherent creditors, are as follows:
- Grace Period: 18 months on both principal and interest, starting from October 2024;[16]
- Repayment Term: Debt to be amortized over 108 months; and
- Principal Repayment Schedule:
- 10% repaid between months 19 and 54;
- 30% between months 55 and 90; and
- 60% between months 91 and 126.
Interest accrues at Certificado de Depósito Interbancário (“CDI”) + 1.25% for three years and increases to CDI + 2.5% thereafter.
The current split of short-term and long-term loans are as follows:
| Loans
CAD $’000 |
Before renegotiation |
After renegotiation |
| Short-term loans |
37,953 |
227 |
| Long-term loans |
9,371 |
45,195 |
| Total |
47,324 |
45,472 |
The Company is now well positioned to weather ongoing macroeconomic volatility while preparing for a potential rebound in sector activity in H2 2025.13
Financial Position
As of June 30, 2025, Verde held cash of $2.4 million, compared to $2.7 million at the end of Q2 2024. Short-term receivables recorded during the quarter were $8.2 million. The total cash and short-term receivables were $10.6 million in Q2 2025.
Outlook
During H2 2025, the Company will focus on:
- Product portfolio expansion via the development of new, customer-driven fertilizer formulations, which have been designed to address evolving agronomic needs while enhancing crop productivity and sustainability. By broadening our suite of multi-nutrient solutions, we aim to deepen relationships with existing growers and distributors and, importantly, attract a wider base of new customers.
- Strengthening our commercial reach — leveraging the recently expanded sales team, targeted marketing initiatives, and data-driven agronomic support — to accelerate market penetration in core regions near our production hub.
- Advancing research on the Company’s carbon project (Enhanced Rock Weathering), reinforcing our long-term vision of delivering agronomic performance alongside measurable environmental benefits.
Q2 Results Conference Call
The Company will host a conference call to discuss Q2 2025 results and provide an update. Subscribe using the link below and receive the conference details by email.
The Company’s financial statements and related notes for the period ended June 30, 2025 are available to the public on SEDAR+ at www.sedarplus.ca and the Company’s website at www.investor.verde.ag/.
About Verde AgriTech
Verde AgriTech is dedicated to advancing sustainable agriculture through the innovation of specialty multi-nutrient potassium fertilizers. Our mission is to increase agricultural productivity, enhance soil health, and significantly contribute to environmental sustainability. Utilizing our unique position in Brazil, we harness proprietary technologies to develop solutions that not only meet the immediate needs of farmers but also address global challenges such as food security and climate change. Our commitment to carbon capture and the production of eco-friendly fertilizers underscores our vision for a future where agriculture contributes positively to the health of our planet.
For more information on how we are leading the way towards sustainable agriculture and climate change mitigation in Brazil, visit our website at https://verde.ag/en/home/.
For additional information please contact:
Cristiano Veloso, Chief Executive Officer and Founder
Tel: +55 (31) 3245 0205; Email: investor@verde.ag
www.verde.ag | www.investor.verde.ag
Cautionary Language and Forward-Looking Statements
All Mineral Reserve and Mineral Resources estimates reported by the Company were estimated in accordance with the Canadian National Instrument 43-101 and the Canadian Institute of Mining, Metallurgy, and Petroleum Definition Standards (May 10, 2014). These standards differ significantly from the requirements of the U.S. Securities and Exchange Commission. Mineral Resources which are not Mineral Reserves do not have demonstrated economic viability.
This document contains “forward-looking information” within the meaning of Canadian securities legislation and “forward-looking statements” within the meaning of the United States Private Securities Litigation Reform Act of 1995. This information and these statements, referred to herein as “forward-looking statements” are made as of the date of this document. Forward-looking statements relate to future events or future performance and reflect current estimates, predictions, expectations or beliefs regarding future events and include, but are not limited to, statements with respect to:
- the estimated amount and grade of Mineral Resources and Mineral Reserves;
- the estimated amount of CO2 removal potential per ton of rock;
- the PFS representing a viable development option for the Project;
- estimates of the capital costs of constructing mine facilities and bringing a mine into production, of sustaining capital and the duration of financing payback periods;
- the estimated amount of future production, both produced and sold;
- timing of disclosure for the PFS and recommendations from the Special Committee;
- the Company’s competitive position in Brazil and demand for potash;
- estimates of operating costs and total costs, net cash flow, net present value and economic returns from an operating mine.
- the expected terms of the debt restructuring;
- the expected financial impact of the debt restructuring to the Company;
- the timeline for court approval of the debt restructuring; and
- the potential arising from the re-assaying of certain core samples.
Any statements that express or involve discussions with respect to predictions, expectations, beliefs, plans, projections, objectives or future events or performance (often, but not always, using words or phrases such as “expects”, “anticipates”, “plans”, “projects”, “estimates”, “envisages”, “assumes”, “intends”, “strategy”, “goals”, “objectives” or variations thereof or stating that certain actions, events or results “may”, “could”, “would”, “might” or “will” be taken, occur or be achieved, or the negative of any of these terms and similar expressions) are not statements of historical fact and may be forward-looking statements.
All forward-looking statements are based on Verde’s or its consultants’ current beliefs as well as various assumptions made by them and information currently available to them. The most significant assumptions are set forth above, but generally these assumptions include, but are not limited to:
- the presence of and continuity of resources and reserves at the Project at estimated grades;
- the estimation of CO2 removal based on the chemical and mineralogical composition of assumed resources and reserves;
- the geotechnical and metallurgical characteristics of rock conforming to sampled results; including the quantities of water and the quality of the water that must be diverted or treated during mining operations;
- the capacities and durability of various machinery and equipment;
- the availability of personnel, machinery and equipment at estimated prices and within the estimated delivery times;
- currency exchange rates;
- Super Greensand® and K Forte® sales prices, market size and exchange rate assumed;
- appropriate discount rates applied to the cash flows in the economic analysis;
- tax rates and royalty rates applicable to the proposed mining operation;
- the availability of acceptable financing under assumed structure and costs;
- anticipated mining losses and dilution;
- reasonable contingency requirements;
- success in realizing proposed operations;
- receipt of permits and other regulatory approvals on acceptable terms; and
- the fulfilment of environmental assessment commitments and arrangements with local
Although management considers these assumptions to be reasonable based on information currently available to it, they may prove to be incorrect. Many forward-looking statements are made assuming the correctness of other forward looking statements, such as statements of net present value and internal rates of return, which are based on most of the other forward-looking statements and assumptions herein. The cost information is also prepared using current values, but the time for incurring the costs will be in the future and it is assumed costs will remain stable over the relevant period.
By their very nature, forward-looking statements involve inherent risks and uncertainties, both general and specific, and risks exist that estimates, forecasts, projections, and other forward-looking statements will not be achieved or that assumptions do not reflect future experience. We caution readers not to place undue reliance on these forward-looking statements, as a number of important factors could cause the actual outcomes to differ materially from the beliefs, plans, objectives, expectations, anticipations, estimates, assumptions, and intentions expressed in such forward-looking statements. These risk factors may be generally stated as the risk that the assumptions and estimates expressed above do not occur as forecast, but specifically include, without limitation: risks related to the court approval process for the debt restructuring; risks relating to variations in the mineral content within the material identified as Mineral Resources and Mineral Reserves from that predicted; variations in rates of recovery and extraction; the geotechnical characteristics of the rock mined or through which infrastructure is built differing from that predicted, the quantity of water that will need to be diverted or treated during mining operations being different from what is expected to be encountered during mining operations or post-closure, or the rate of flow of the water being different; developments in world metals markets; risks relating to fluctuations in the Brazilian Real relative to the Canadian dollar; increases in the estimated capital and operating costs or unanticipated costs; difficulties attracting the necessary workforce; increases in financing costs or adverse changes to the terms of available financing, if any; tax rates or royalties being greater than assumed; changes in development or mining plans due to changes in logistical, technical, or other factors; changes in project parameters as plans continue to be refined; risks relating to receipt of regulatory approvals; delays in stakeholder negotiations; changes in regulations applying to the development, operation, and closure of mining operations from what currently exists; the effects of competition in the markets in which Verde operates; operational and infrastructure risks and the additional risks described in Verde’s Annual Information Form filed with SEDAR+ in Canada (available at www.sedarplus.com) for the year ended December 31, 2024. Verde cautions that the foregoing list of factors that may affect future results is not exhaustive.
When relying on our forward-looking statements to make decisions with respect to Verde, investors and others should carefully consider the foregoing factors and other uncertainties and potential events. Verde does not undertake to update any forward-looking statement, whether written or oral, that may be made from time to time by Verde or on our behalf, except as required by law.
[1] The carbon capture potential of Verde’s products, through Enhanced Rock Weathering (ERW), is 120 kg CO2e per ton of K Forte®. For further information, see “Verde’s Products Remove Carbon Dioxide From the Air”.
[2] K Forte® is a fertilizer produced in Brazil using national raw materials. Its production process has low energy consumption from renewable sources and, consequently, a low environmental and GHG emissions footprint. Whereas the high carbon footprint of KCl results from a complex production process, involving extraction, concentration, and granulation of KCl, in addition to the long transportation distances to Brazil, given that 95% of the KCl consumed in the country is imported. 12Mt of K Forte® is equivalent to 2Mt of KCl in K2O content. Emissions avoided are calculated as the difference between the weighted average emissions for KCl suppliers to produce, deliver, and apply their product in each customer’s city and the emissions determined according to K Forte®’s Life Cycle Assessment for its production, delivery, and application in each customer’s city.
[3] From 2018 to Q2 2025, the Company has sold 2.3 million tons of Product, which can potentially remove up to 251,734 tons of CO2. Additionally, this amount of Product could potentially avoid up to 63,829 tons of CO2 emissions.
[4] Verde’s Product is a salinity and chloride-free replacement for KCl fertilizers. Potassium chloride is composed of approximately 46% of chloride, which can have biocidal effects when excessively applied to soils. According to Heide Hermary (Effects of some synthetic fertilizers on the soil ecosystem, 2007), applying 1 pound of potassium chloride to the soil is equivalent to applying 1 gallon of Clorox bleach, with regard to killing soil microorganisms. Soil microorganisms play a crucial role in agriculture by capturing and storing carbon in the soil, making a significant contribution to the global fight against climate change.
[5] 1 ton of Product (10% K2O) has 0.1 tons of K2O, which is equivalent to 0.17 tons of potassium chloride (60% K2O), containing 0.08 tons of chloride.
[6] Source: Lack of Credit Challenges Brazil’s Agricultural Inputs Market, AgriBrasilis, July 23, 2025. Available at: https://agribrasilis.com/2025/07/23/credit-access-agricultural-inputs/.
[7] Source: Acerto Limited.
[8] Source: Lavoro Restructures $460 Million Debt to Secure Crop Input Supply, The AgriBiz. Available at: https://www.theagribiz.com/international/lavoro-restructures-460-million-debt-to-secure-crop-input-supply/.
[9] As of June 30, 2025. Source: Brazilian Central Bank
[10] As of June 30, 2025. Source: Brazilian Central Bank
[11] Source: J.P. Morgan, COPOM Preview, Latin America Emerging Markets Research, August 5, 2025.
[12] As of June 30, 2025. Source: Brazilian Central Bank
[13] “US sanctions could cause chaos on Latam farms run on Russian fertilizers,” Reuters, July 21, 2025. Available at: https://www.reuters.com/world/americas/us-sanctions-could-cause-chaos-latam-farms-run-russian-fertilizers-2025-07-21
[14] Verde’s production costs and sales price are based on the following assumptions:
- Micronutrients added to the product increase its production cost, rendering K Forte® less expensive to produce.
- Production costs vary based on packaging type, with bulk being less expensive than Jumbo Bags.
- Plant 1 produces K Forte® Jumbo Bags and Low-Carbon Specialty Fertilizer Products, while Plant 2 exclusively produces K Forte® Bulk. Therefore, Plant 2’s production costs are lower than Plant 1’s costs.
[15] Reference rate.
[16] With the exception of a symbolic monthly payment of R$100,000 from May 2025 onwards.
Singapore. Verde AgriTech Ltd (TSX: “NPK”) (“Verde” or the “Company”) announces its financial results for the full year ended December 31, 2024 (“FY 2024”) and the fourth quarter 2024 (“Q4 2024), as audited by RSM.
“Looking back, 2023/24 will undoubtedly be remembered as one of the most challenging periods for Brazilian agriculture in this century. A historic number of farmers and input suppliers faced insolvency, overwhelmed by an unprecedented combination of economic and climatic challenges. The effects of this crisis have already spilled into the first half of 2025, continuing to present significant obstacles for the sector. Navigating through this ‘perfect storm’ required exceptional resilience, and those who persevered have demonstrated remarkable strength and adaptability,” stated Cristiano Veloso, Founder and CEO of Verde Agritech.
“For H2 2025 deliveries, we are seeing strong market optimism driven not only by favorable geopolitical factors but also by improved commodity prices, better climatic conditions, and a recovering global supply chain. Verde is strategically positioned to capitalize on the resurgence of Brazil’s agricultural profitability, which is bolstered by these favorable dynamics. Our order books for the second half of the year reflect significant growth to date, marking a notable improvement compared to 2024,” Mr. Veloso added.
As previously announced on October 2, 2024[1], the Company successfully renegotiated its loans with its two largest creditors, covering 73% of its total outstanding debt. This deal, which extends the repayment term to 120 months and suspends principal payments for 18 months, is projected to generate R$115 million in cash savings over the next 24 months. Interest payments will also be suspended during this period, with a significantly reduced interest rate to follow. The agreement has proven to be a critical step in strengthening Verde’s financial position.
Further progress was reported on November 11, 2024[2] when Verde secured an agreement with creditors representing over 92% of the company’s total debt, leading to improved financial terms for the company. Non-adherent creditors will face a 75% reduction in their outstanding balance, with the remaining debt subject to a much lower interest rate of 0.82% per year. The agreement, which is pending court approval, is expected to result in the cancellation of R$8.5 million in debt.
Additionally, Verde successfully renegotiated additional loans. This comprehensive effort means that more than 99.8% of the Company’s outstanding debts have now been renegotiated, significantly reducing its short-term obligations for 2025 to R$1.5 million.
“It has been over four months since we entered the final stage of the renegotiation process, and we are now awaiting the homologation of the agreement by the court. We remain confident that the approval is imminent, and its recognition will be finalized soon. This will be a significant milestone for the Company,” stated Cristiano Veloso, Founder and CEO of Verde Agritech.
Fourth Quarter and Full Year 2024 Highlights
Operational and Financial Highlights
- Verde’s sales volume amounted to 319,000 tons; a 25% reduction compared to 2023. Additionally, revenue had a 43% decrease compared to the previous year, with $21.6 million in FY 2024. In 2025, after only 79 days, Verde already has orders and delivered products representing over 60% of all products delivered in 2024.
- Cash held by the Company decreased by $3.5 million, from $6.9 million in FY 2023 to $3.4 million in FY 2024. Additionally, the Company has $6.9 million in short-term receivables. The total Cash and short-term receivables were $10.3 million in FY 2024.
- EBITDA before non-cash events was -$2.5 million in FY 2024, compared to $2.0 million in FY 2023.
- The Company reported a net loss of -$12.6 million in FY 2024, compared to a net loss of -$6.0 million in FY 2023.
- Sales and General Administrative Expenses decreased by $1.6 million, from $11.7 million in 2023 to $10.1 million.
Other Highlights
- The Product sold in FY 2024 has the potential to capture up to 25,429 tons of carbon dioxide (“CO2”) from the atmosphere via Enhanced Rock Weathering (“ERW”).[3] The potential net amount of carbon captured is estimated at 16,255 tons of CO2. In addition to the carbon removal potential, Verde’s FY 2024 sales avoided the emissions of 9,116 tons of CO2e, by substituting potassium chloride (“KCl”) fertilizers.[4]
- Combining the potential carbon removal and carbon emissions avoided by the use our Product since the start of production in 2018, Verde’s total impact stands at 297,782 tons of CO2.[5]
- 16,776 tons of chloride have been prevented from being applied into soils FY 2024, by farmers who used the Product in lieu of KCl fertilizers.[6] A total of 155,935 tons of chloride has been prevented from being applied into soil by Verde’s customers since the Company started production.[7]
2024 Year in Review
Agricultural Market
In 2024, many agricultural businesses have been confronted with severe liquidity challenges, prompting an increasing number to seek insolvency protection as part of efforts to restructure their debts. The scarcity of accessible credit has not only hindered investments but also disrupted the broader agribusiness ecosystem, impacting suppliers and financial institutions alike. This crisis stems from the high commodity prices at the beginning of 2022, which led farmers to expect that both commodity and input prices would remain elevated. However, while input costs stayed high for longer, commodity prices began to drop. As a result, farmers who purchased fertilizers at elevated prices, expecting high commodity prices, were left struggling with mismatched financial conditions. Consequently, 2024 continues to be marked by significant financial strain, as businesses work to manage the debt burdens accumulated in recent years.
Furthermore, economic instability in Brazil further intensified challenges in the agricultural market. High interest rates and fluctuating exchange rates created additional financial strain for farmers, limiting their access to working capital. Amid the record rise in farmer insolvencies, several distributors experienced financial distress, with some seeking credit protection. In response, Verde adopted a cautious approach to farmer financing, prioritizing financial stability over short-term sales growth. The Company chose to limit credit offerings, forgoing potential sales to minimize exposure to default risks, which inevitably had an impact on overall sales performance.
Global market competition
The Brazilian agricultural sector faced significant challenges in 2024, driven by evolving macroeconomic factors. The Selic interest rate, which stood at 12.25% by the end of the year, restricted farmers’ access to credit, limiting their ability to invest in productivity-enhancing input. Projections suggest a gradual increase in the Selic rate in 2025, with estimates indicating 15.00% by the end of 2025, followed by a potential decrease to 12.50% by 2026. Annual inflation forecasts for 2025 and 2026 stand at 5.50% and 4.20%, respectively, which may provide some relief as economic conditions stabilize.[8]
In 2024, Verde’s average cost of debt was 16.2% per annum, reflecting the high-interest environment that has become a defining characteristic of the current economic landscape. Brazilian corporations, particularly those in the agricultural sector, faced significant financial constraints and limited access to working capital, which further hampered their ability to invest in productivity and input purchases. Compared to international players, Verde’s capacity to offer financing with longer tenors is considerably limited, putting the company at a disadvantage in terms of competitive financing options for its customers. Unlike many of its competitors, Verde does not have the ability to shift a significant portion of its debt to US dollar-denominated liabilities at attractive interest rates, further amplifying the impact of local interest rates on its financial flexibility.
Amid these challenging market conditions, Brazilian farmers faced tight working capital during the critical period for purchasing inputs like fertilizers for the upcoming planting season. In response, many farmers sought suppliers offering the most favorable payment terms and interest rates, opting to defer payments until after the harvest, typically between 9 to 12 months later. While this approach is common in the agricultural sector, it increases the risk of non-payment for suppliers, including fertilizer companies, reflecting the heightened financial pressures within the industry.
Currency exchange rate
Canadian dollar valuated by 6.2% versus Brazilian Real in FY 2024 compared to FY 2023[9].
Q4 and FY 2024 Results Conference Call
The Company will host a conference call to discuss Q4 and FY 2024 results and provide an update. Subscribe using the link below and receive the conference details by email.
The questions must be submitted in advance through the following link before the conference call: https://bit.ly/Q4_andFY2024_Questions
The Company’s full year and fourth quarter financial statements and related notes for the period ended December 31, 2024 are available to the public on SEDAR at www.sedar.com and the Company’s website at www.investor.verde.ag/.
Results of Operations
The following table provides information about three and twelve months ended December 31, 2024 as compared to the three and twelve months ended December 31, 2023. All amounts in CAD $’000.
| All amounts in CAD $’000 |
3 months ended
Dec 31, 2024 |
3 months ended
Dec 31, 2023 |
12 months ended
Dec 31, 2024 |
12 months ended
Dec 31, 2023 |
| Tons sold (‘000) |
48 |
104 |
319 |
428 |
| Average revenue per ton sold $ |
60 |
68 |
68 |
89 |
| Average production cost per ton sold $ |
(21) |
(21) |
(20) |
(23) |
| Average gross profit per ton sold $ |
39 |
47 |
48 |
66 |
| Average gross margin |
65% |
68% |
71% |
74% |
| |
|
|
|
|
| Revenue |
2,888 |
7,058 |
21,597 |
37,863 |
| Production costs |
(986) |
(2,230) |
(6,302) |
(9,689) |
| Gross Profit |
1,902 |
4,828 |
15,295 |
28,174 |
| Gross Margin |
65% |
68% |
71% |
74% |
| Sales and marketing expenses |
(842) |
(996) |
(3,686) |
(4,022) |
| Product delivery freight expenses |
(938) |
(3,001) |
(7,705) |
(14,510) |
| General and administrative expenses |
(1,947) |
(2,527) |
(6,432) |
(7,666) |
| EBITDA (1) |
(1,825) |
(1,696) |
(2,528) |
1,976 |
| Share Based, Equity and Bonus Payments (Non-Cash Event) (2) |
13 |
(304) |
(2,133) |
(449) |
| Depreciation and Amortization (3) |
(753) |
(640) |
(3,232) |
(3,716) |
| Operating (Loss) / Profit after non-cash events |
(2,565) |
(2,640) |
(7,893) |
(2,189) |
| Interest Income/Expense (4) |
(262) |
(2,795) |
(4,634) |
(6,381) |
| Net (Loss) / Profit before tax |
(2,827) |
(5,435) |
(12,527) |
(8,570) |
| Income tax (5) |
(4) |
2,787 |
(31) |
2,591 |
| Net (Loss) / Profit |
(2,831) |
(2,648) |
(12,558) |
(5,979) |
(1) – Non GAAP measure
(2) – Included in General and Administrative expenses in financial statements
(3) – Included in General and Administrative expenses and Cost of Sales in financial statements
(4) – Please see Summary of Interest-Bearing Loans and Borrowings notes
(5) – Please see Income Tax notes
External Factors
Revenue and costs are affected by external factors including changes in the exchange rates between the C$ and R$ along with fluctuations in potassium chloride spot CFR Brazil, agricultural commodities prices, interest rates, among other factors. For further details, please refer to the 2024 Year in Review section (page 3).
Financial and operating results
In FY 2024, revenue from sales fell by 43%, accompanied by a 23% reduction in the average revenue per ton. Excluding freight expenses (FOB price), the average revenue per ton decreased by 20%. This decline in average revenue per ton was primarily attributed to a decrease in potassium chloride prices, the provision of additional discounts by the Company to strategic customers to increase market adoption, and a shift in the product mix due to farmers limited working capital. With many farmers facing restricted cash flows, there has been a noticeable shift towards opting for lower-value-added products. Despite these challenges, Verde managed to increase sales of premium products, with Low-Carbon Specialty Fertilizer Products accounting for 13% of total sales in 2024, up from 7% in 2023. However, the share of sales in big bags declined from 20% in FY 2023 to 13% in FY 2024, negatively impacting the average revenue per ton.
The decline in sales price per ton and volume were the key drivers of the Company’s significantly lower results compared to the previous year. Additionally, the Company continues to maintain a high level of Expected Credit Losses (“ECL”), which further impacted EBITDA negatively. The Company is actively negotiating with these clients, and if successful, the provision will be reversed.
The Company generated a net loss of -$12.6 million in FY 2024, compared to a net loss of -$6.0 million in FY 2023.
Basic loss per share was -$0.24 for FY 2024, compared to a basic loss per share of -$0.11 for FY 2023.
Production costs
The average cost per ton fell by 13% in FY 2024, driven by fluctuations in the Brazilian real and a shift towards greater utilization of Plant 2, which operates at a lower cost than Plant 1 due to enhanced operational efficiency. Sales from Plant 2 accounted for 76% of total sales in 2024, further contributing to the reduction in average production costs per ton.
Production costs include all direct costs from mining, processing, and the addition of other nutrients to the Product, such as Sulphur and Boron. It also includes the logistics costs from the mine to the plant and related salaries.
Verde’s production costs and sales price are based on the following assumptions:
- Micronutrients added to the product increase its production cost, rendering K Forte® less expensive to produce.
- Production costs vary based on packaging type, with bulk being less expensive than Jumbo Bags.
- Plant 1 produces K Forte® Jumbo Bags and Low-Carbon Specialty Fertilizer Products, while Plant 2 exclusively produces K Forte® Bulk. Therefore, Plant 2’s production costs are lower than Plant 1’s costs.
Sales, General and Administrative Expenses:
SG&A represents a non-operating segment that includes corporate and administrative functions, essential for supporting the Company’s operating segments.
Sales Expenses
| CAD $’000 |
3 months ended |
3 months ended |
12 months ended |
12 months ended |
| Dec 31, 2024 |
Dec 31, 2023 |
Dec 31, 2024 |
Dec 31, 2023 |
| Sales and marketing expenses |
(740) |
(923) |
(3,246) |
(3,912) |
| Fees paid to independent sales agents |
(102) |
(73) |
(440) |
(110) |
| Total |
(842) |
(996) |
(3,686) |
(4,022) |
Sales and marketing expenses cover salaries for employees, car rentals, domestic travel in Brazil, hotel accommodations, and Product promotion at marketing events.
As part of the Company’s sales and marketing strategy, Verde compensates its independent sales agents through commissions. Fees paid to independent sales agents increased by $330,000 in FY 2024, partially due to a $249,000 provision reversal recorded in 2023.
Product delivery freight expenses
Expenses decreased by 47% in FY 2024, to $7.7 million compared to $14.5 million in FY 2023. The volume sold as CIF (Cost Insurance and Freight) in 2024 represented 74% of total sales, compared to 71% in FY 2023. However, the Company achieved a reduction in average freight costs per ton for products sold on a CIF basis, to $33 in 2024 from $48 in the comparable period of the previous year. The 31% decrease in freight costs can primarily be attributed to a reduction in the percentage of sales made to regions that are more distant from Verde’s production facilities.
General and Administrative Expenses
| CAD $’000 |
3 months ended
Dec 31, 2024 |
3 months ended
Dec 31, 2023 |
12 months ended
Dec 31, 2024 |
12 months ended
Dec 31, 2023 |
| General administrative expenses |
(330) |
(665) |
(2,413) |
(3,646) |
| Allowance for expected credit losses |
(1,302) |
(1,138) |
(2,320) |
(1,754) |
| Legal, professional, consultancy and audit costs |
(207) |
(521) |
(1,112) |
(1,435) |
| IT/Software expenses |
(102) |
(182) |
(529) |
(715) |
| Taxes and licenses fees |
(6) |
(21) |
(58) |
(116) |
| Total |
(1,947) |
(2,527) |
(6,432) |
(7,666) |
General administrative expenses include office expenses, rent, bank fees, insurance, foreign exchange variances, and remuneration for executives, Board directors, and administrative staff. In FY 2024, general administrative expenses decreased by 34%, primarily due to a series of contract renegotiations with suppliers, a reduction in administrative headcount, and lower leasing expenses, such as water trucks and metallic structures used to support operations.
As per Verde’s sales policy, any outstanding customer payments overdue for more than 12 months must be provisioned. The total ECLs booked in Q4 2024 amounted to $2.3 million, compared to $1.8 million of provision in Q4 2023. In 2024, the agricultural sector experienced a significant rise in insolvency protection cases, directly impacting a portion of Verde’s clients.
Legal, professional and audit costs include fees along with accountancy, audit and regulatory costs. Consultancy fees encompass consultants employed in Brazil, such as accounting services, patent processes, lawyer’s fees and regulatory consultants.
Share Based, Equity and Bonus Payments (Non-Cash Events) encompass expenses associated with stock options granted to employees and directors, as well as equity compensation and non-cash bonuses awarded to key management personnel. In FY 2024, the costs associated with share-based, equity, and bonus payments increased. This was primarily due to new options issuance.
Income tax
Brazilian corporations are subject to income taxes (IRPJ and CSLL) using an ‘Actual Profits’ method (i.e. APM – “Lucro Real”, in Portuguese), which is based on taxable income (the tax in this method is approximately 34% of the EBITDA), adjusted by certain additions and exclusions as determined by the legislation.
As of January 2023, the Brazilian subsidiary switched from ‘Assumed Profits’ taxation to ‘Real Profits’ taxation. With this transition, the Subsidiary is allowed to offset up to 30% of accumulated losses in subsequent years when profits are generated. Based on the projected taxable income, considering the approved budget and an extended period of up to ten years the recognized deferred tax assets on the Brazilian entities are deemed recoverable, resulting in the recognition of $2.8 million of deferred tax assets in such entity. The Company also recognized an allowance for tax losses carry forward for the amount that is not expected to be offset against future taxable income within ten years.
Liquidity and Cash Flows
For additional details see the consolidated statements of cash flows for the quarters ended December 31, 2024 and December 31, 2023 in the financial statements.
| Cash received from / (used for):
CAD $’000 |
3 months ended
Dec 31, 2024 |
3 months ended
Dec 31, 2023 |
12 months ended
Dec 31, 2024 |
12 months ended
Dec 31, 2023 |
| Operating activities |
(214) |
20,709 |
(1,885) |
4,619 |
| Investing activities |
(197) |
(2,308) |
753 |
(4,022) |
| Financing activities |
171 |
(20,806) |
(3,120) |
5,017 |
On December 31, 2024, the Company held cash of $3.4 million, a decrease of $3.5 million on the same period in 2023. In addition, the Company had $6.9 million in short-term receivables, bringing the total of cash and receivables to $10.3 million in FY 2024.
Operating activities
In agricultural sales, credit transactions are common due to the cyclical nature of farming income, which sees fluctuations with seasonal highs during harvests and lows during planting. This cycle necessitates that farmers have access to essential inputs like seeds, fertilizers, and pesticides ahead of their selling season. To accommodate this, credit terms are offered, allowing farmers to procure these inputs in advance and align their payments with their revenue cycle.
Verde’s approach to credit in the agricultural sector reflects a deep understanding of these operational nuances, resulting in a substantial portfolio of receivables. The Company’s credit term is 30 to 120 days upon shipment, depending on the period of the year, tailored to the specific needs of each farmer, considering the crop cycle, creditworthiness, and other key factors. This strategy ensures farmers have the necessary resources for each planting season, while Verde secures its financial interests through aligned payment schedules.
Net cash generated under operating activities decreased to -$1.9 million in FY 2024, compared to $4.6 million in FY 2023. This was mainly due to a decrease in receivables and payables from the last financial year.
Trade and short-term receivables decreased by 50% in FY 2024, to $6.9 million compared to $13.7 million in 2023. Trade and other payables decreased by 57% in FY 2024, to $1.7 million compared to $4.0 million in 2023.
Investing activities
Cash utilized from investing activities increased to $0.8 million in FY 2024, compared to -$4.0 million in 2023. This increase was due to the redemption of financial applications.
Financing activities
Cash generated from financing activities decreased to -$3.1 million in FY 2024, compared to $5.0 million in FY 2023. This decline resulted from a lower volume of loans issued in 2024 compared to the previous year.
Financial condition
The Company’s current assets decreased to $12.0 million in 2024, compared to $23.0 million in 2023. Current liabilities decreased to $2.0 million in FY 2024, compared to $40.0 in FY 2023, providing a working capital surplus of $10.0 million in 2024. This improvement was primarily driven by the renegotiation of loans, extending their repayment terms to the long term, which positively impacted the Group’s working capital position. Although the restructuring plan is pending court homologation, most of the creditors have agreed to the new terms.
About Verde AgriTech
Verde AgriTech is dedicated to advancing sustainable agriculture through the innovation of specialty multi-nutrient potassium fertilizers. Our mission is to increase agricultural productivity, enhance soil health, and significantly contribute to environmental sustainability. Utilizing our unique position in Brazil, we harness proprietary technologies to develop solutions that not only meet the immediate needs of farmers but also address global challenges such as food security and climate change. Our commitment to carbon capture and the production of eco-friendly fertilizers underscores our vision for a future where agriculture contributes positively to the health of our planet.
For more information on how we are leading the way towards sustainable agriculture and climate change mitigation in Brazil, visit our website at https://verde.ag/en/home/.
Corporate Presentation
For further information on the Company, please view shareholders’ deck:
https://verde.docsend.com/view/ggz6zdd3dk3uxakd
Company Updates
Verde invites you to subscribe for updates. By signing up, you’ll receive the latest news about the Company’s projects, achievements, and future plans.
Subscribe here: http://cloud.marketing.verde.ag/InvestorsSubscription
Cautionary Language and Forward-Looking Statements
All Mineral Reserve and Mineral Resources estimates reported by the Company were estimated in accordance with the Canadian National Instrument 43-101 and the Canadian Institute of Mining, Metallurgy, and Petroleum Definition Standards (May 10, 2014). These standards differ significantly from the requirements of the U.S. Securities and Exchange Commission. Mineral Resources which are not Mineral Reserves do not have demonstrated economic viability.
This document contains “forward-looking information” within the meaning of Canadian securities legislation and “forward-looking statements” within the meaning of the United States Private Securities Litigation Reform Act of 1995. This information and these statements, referred to herein as “forward-looking statements” are made as of the date of this document. Forward-looking statements relate to future events or future performance and reflect current estimates, predictions, expectations or beliefs regarding future events and include, but are not limited to, statements with respect to:
- the estimated amount and grade of Mineral Resources and Mineral Reserves;
- the estimated amount of CO2 removal potential per ton of rock;
- the PFS representing a viable development option for the Project;
- estimates of the capital costs of constructing mine facilities and bringing a mine into production, of sustaining capital and the duration of financing payback periods;
- the estimated amount of future production, both produced and sold;
- timing of disclosure for the PFS and recommendations from the Special Committee;
- the Company’s competitive position in Brazil and demand for potash;
- estimates of operating costs and total costs, net cash flow, net present value and economic returns from an operating mine.
- the expected terms of the debt restructuring;
- the expected financial impact of the debt restructuring to the Company;
- the timeline for court approval of the debt restructuring; and
- the potential arising from the re-assaying of certain core samples.
Any statements that express or involve discussions with respect to predictions, expectations, beliefs, plans, projections, objectives or future events or performance (often, but not always, using words or phrases such as “expects”, “anticipates”, “plans”, “projects”, “estimates”, “envisages”, “assumes”, “intends”, “strategy”, “goals”, “objectives” or variations thereof or stating that certain actions, events or results “may”, “could”, “would”, “might” or “will” be taken, occur or be achieved, or the negative of any of these terms and similar expressions) are not statements of historical fact and may be forward-looking statements.
All forward-looking statements are based on Verde’s or its consultants’ current beliefs as well as various assumptions made by them and information currently available to them. The most significant assumptions are set forth above, but generally these assumptions include, but are not limited to:
- the presence of and continuity of resources and reserves at the Project at estimated grades;
- the estimation of CO2 removal based on the chemical and mineralogical composition of assumed resources and reserves;
- the geotechnical and metallurgical characteristics of rock conforming to sampled results; including the quantities of water and the quality of the water that must be diverted or treated during mining operations;
- the capacities and durability of various machinery and equipment;
- the availability of personnel, machinery and equipment at estimated prices and within the estimated delivery times;
- currency exchange rates;
- Super Greensand® and K Forte® sales prices, market size and exchange rate assumed;
- appropriate discount rates applied to the cash flows in the economic analysis;
- tax rates and royalty rates applicable to the proposed mining operation;
- the availability of acceptable financing under assumed structure and costs;
- anticipated mining losses and dilution;
- reasonable contingency requirements;
- success in realizing proposed operations;
- receipt of permits and other regulatory approvals on acceptable terms; and
- the fulfilment of environmental assessment commitments and arrangements with local
Although management considers these assumptions to be reasonable based on information currently available to it, they may prove to be incorrect. Many forward-looking statements are made assuming the correctness of other forward looking statements, such as statements of net present value and internal rates of return, which are based on most of the other forward-looking statements and assumptions herein. The cost information is also prepared using current values, but the time for incurring the costs will be in the future and it is assumed costs will remain stable over the relevant period.
By their very nature, forward-looking statements involve inherent risks and uncertainties, both general and specific, and risks exist that estimates, forecasts, projections and other forward-looking statements will not be achieved or that assumptions do not reflect future experience. We caution readers not to place undue reliance on these forward-looking statements as a number of important factors could cause the actual outcomes to differ materially from the beliefs, plans, objectives, expectations, anticipations, estimates assumptions and intentions expressed in such forward-looking statements. These risk factors may be generally stated as the risk that the assumptions and estimates expressed above do not occur as forecast, but specifically include, without limitation: risks related to the court approval process for the debt restructuring; risks relating to variations in the mineral content within the material identified as Mineral Resources and Mineral Reserves from that predicted; variations in rates of recovery and extraction; the geotechnical characteristics of the rock mined or through which infrastructure is built differing from that predicted, the quantity of water that will need to be diverted or treated during mining operations being different from what is expected to be encountered during mining operations or post closure, or the rate of flow of the water being different; developments in world metals markets; risks relating to fluctuations in the Brazilian Real relative to the Canadian dollar; increases in the estimated capital and operating costs or unanticipated costs; difficulties attracting the necessary work force; increases in financing costs or adverse changes to the terms of available financing, if any; tax rates or royalties being greater than assumed; changes in development or mining plans due to changes in logistical, technical or other factors; changes in project parameters as plans continue to be refined; risks relating to receipt of regulatory approvals; delays in stakeholder negotiations; changes in regulations applying to the development, operation, and closure of mining operations from what currently exists; the effects of competition in the markets in which Verde operates; operational and infrastructure risks and the additional risks described in Verde’s Annual Information Form filed with SEDAR in Canada (available at www.sedar.com) for the year ended December 31, 2023. Verde cautions that the foregoing list of factors that may affect future results is not exhaustive.
When relying on our forward-looking statements to make decisions with respect to Verde, investors and others should carefully consider the foregoing factors and other uncertainties and potential events. Verde does not undertake to update any forward-looking statement, whether written or oral, that may be made from time to time by Verde or on our behalf, except as required by law.
For additional information please contact:
Cristiano Veloso, Chief Executive Officer and Founder
Tel: +55 (31) 3245 0205; Email: investor@verde.ag
www.verde.ag | www.investor.verde.ag
[1] Learn more at: Verde Successfully Renegotiates Loans with Its Two Largest Creditors
[2] Learn more at: Verde Secures Debt Renegotiation Agreement Covering 92% of Total Debts, Reaching Improved Financial Terms
[3] The carbon capture potential of Verde’s products, through Enhanced Rock Weathering (ERW), is 120 kg CO2e per ton of K Forte®. For further information, see “Verde’s Products Remove Carbon Dioxide From the Air”.
[4] K Forte® is a fertilizer produced in Brazil using national raw materials. Its production process has low energy consumption from renewable sources and, consequently, a low environmental and GHG emissions footprint. Whereas the high carbon footprint of KCl results from a complex production process, involving extraction, concentration, and granulation of KCl, in addition to the long transportation distances to Brazil, given that 95% of the KCl consumed in the country is imported. 12Mt of K Forte® is equivalent to 2Mt of KCl in K2O content. Emissions avoided are calculated as the difference between the weighted average emissions for KCl suppliers to produce, deliver, and apply their product in each customer’s city and the emissions determined according to K Forte®’s Life Cycle Assessment for its production, delivery, and application in each customer’s city.
[5] From 2018 to 2024, the Company has sold 1.85 million tons of Product, which can potentially remove up to 231,376 tons of CO2. Additionally, this amount of Product could potentially prevent up to 66,405 tons of CO2 emissions.
[6] Verde’s Product is a salinity and chloride-free replacement for KCl fertilizers. Potassium chloride is composed of approximately 46% of chloride, which can have biocidal effects when excessively applied to soils. According to Heide Hermary (Effects of some synthetic fertilizers on the soil ecosystem, 2007), applying 1 pound of potassium chloride to the soil is equivalent to applying 1 gallon of Clorox bleach, with regard to killing soil microorganisms. Soil microorganisms play a crucial role in agriculture by capturing and storing carbon in the soil, making a significant contribution to the global fight against climate change.
[7] 1 ton of Product (10% K2O) has 0.1 tons of K2O, which is equivalent to 0.17 tons of potassium chloride (60% K2O), containing 0.08 tons of chloride.
[8] As of December 30, Source: Brazilian Central Bank.
[9] Source: Brazilian Central Bank.
