Five of seven RC holes return 7–29 m intervals at 0.53%–0.77% TREO to EOH; two deep five-metre intervals exceed 0.90% TREO and 0.23% MREO
BELO HORIZONTE, Brazil and SINGAPORE — September 8, 2026 — Magnes Rare Earths (“Magnes”), a wholly owned subsidiary of Verde AgriTech Ltd. (TSX: NPK | OTCQX: VNPKF) (“Verde” or the “Company”), is pleased to report additional head-grade rare earth assay results from 146 drill holes totalling 1,299 assayed metres at the Minas Americas Global Alliance project (“Minas Americas” or the “Project”) in Minas Gerais, Brazil. The results comprise 139 completed auger holes totalling 1,027 m and the first seven completed or reconciled reverse-circulation (“RC”) holes comprising 272 assayed metres.
The new auger results are led by MAV_AD_0375, the highest-grade full-hole, from-surface interval reported at Minas Americas to date. The hole returned 15 m from surface to the end of hole (“EOH”) averaging 11,480 parts per million (“ppm”) total rare earth oxides (“TREO”), or 1.15% TREO, and 2,830 ppm magnetic rare earth oxides (“MREO”), comprising 2,752 ppm NdPr oxides and 79 ppm DyTb oxides. MREO represents 24.7% of TREO in the interval. Within the continuous 15 m profile, one metre from 12 m to 13 m returned 19,952 ppm TREO (2.00% TREO) and 5,909 ppm MREO.
The first RC results add a new vertical dimension to the drill-derived dataset. Five of the seven holes returned 7–29 m intervals averaging 0.53%–0.77% TREO to EOH, including four intervals at least 15 m long. MAV_RC_0012 returned 29 m from 31 m to the 60 m EOH at 5,751 ppm TREO (0.58% TREO) and 1,346 ppm MREO. Two separate five-metre intervals at depths between 38 m and 51 m exceeded 0.90% TREO and 0.23% MREO: MAV_RC_0012 returned 5 m from 38 m to 43 m at 9,106 ppm TREO, 2,315 ppm MREO and 566 ppm heavy rare-earth oxides (“HREO”), including 100 ppm DyTb oxides; MAV_RC_0005 returned 5 m from 46 m to 51 m at 9,191 ppm TREO, 2,429 ppm MREO and 430 ppm HREO, including 91 ppm DyTb oxides.
| “Today’s results give us the strongest combination yet of near-surface grade, depth and magnet rare-earth content at Minas Americas,” said Cristiano Veloso, Founder and Chief Executive Officer of Magnes Rare Earths. “Fifteen metres at 1.15% TREO from surface establishes a new full-hole benchmark for the Project. Just as importantly, our first RC drilling has identified multiple broad, higher-grade intervals far below the reach of the auger program. Five of seven RC holes carry intervals grading between 0.53% and 0.77% TREO to their current depth limits, including 29 metres at 0.58% TREO to the bottom of a 60-metre hole. The heavy rare-earth component is also emerging in both shallow and deeper drilling, led by 5 metres at 566 ppm HREO—including 100 ppm dysprosium-plus-terbium oxides—in MAV_RC_0012.” |
| “Rare-earth projects will ultimately be judged on recoverable magnet products, not head grade alone. The next value-defining work is to test beneath these current depth limits, connect the expanded dataset in three dimensions and determine recoveries from representative drill composites. With 443 holes and more than 3.6 kilometres of reported assays, Minas Americas now has a substantially stronger platform for that work and for the planned maiden mineral resource estimate.” |
Prior to this release, Magnes had reported assay results from 297 auger holes totalling 2,329.8 m at Minas Americas. This release adds 139 auger holes totalling 1,027 m and seven RC holes comprising 272 assayed metres, for 146 holes and 1,299 m. Cumulative reported assay drilling now totals 443 holes and 3,628.8 m.
Highlights
- Highest-grade full-hole result reported to date: MAV_AD_0375 returned 15 m from surface to EOH at 11,480
ppm TREO (1.15% TREO) and 2,830 ppm MREO, comprising 2,752 ppm NdPr and 79 ppm DyTb. MREO
represents 24.7% of TREO in the interval, which includes one metre at 19,952 ppm TREO (2.00% TREO) and
5,909 ppm MREO.
- Broad interval at depth: MAV_RC_0012 returned 29 m from 31 m to the 60 m EOH at 5,751 ppm TREO (0.58%
TREO) and 1,346 ppm MREO, including 14 m at 6,636 ppm TREO and 1,561 ppm MREO and 5 m at 9,106
ppm TREO and 2,315 ppm MREO. No composite crosses the documented 30–31 m no-recovery interval.
- Five of seven RC holes carry elevated grades to EOH: five holes returned 7–29 m intervals averaging 5,258–
7,744 ppm TREO (0.53%–0.77% TREO) to their current depth limits, including four intervals at least 15 m
long. Mineralization below the current EOH depths remains untested.
- Two deep intervals above 0.90% TREO and 0.23% MREO: MAV_RC_0005 returned 5 m from 46 m to 51 m at
9,191 ppm TREO (0.92% TREO) and 2,429 ppm MREO, while MAV_RC_0012 returned 5 m from 38 m to 43 m
at 9,106 ppm TREO (0.91% TREO) and 2,315 ppm MREO.
- Broad mineralization from surface: MAV_RC_0007 intersected 27 m from surface to EOH at 5,258 ppm TREO
(0.53% TREO) and 1,207 ppm MREO, including 10 m from 7 m to 17 m at 8,215 ppm TREO (0.82% TREO)
and 1,969 ppm MREO.
- High auger grades repeat across multiple holes: four separate auger holes returned complete, from-surface
averages of 0.86%–1.15% TREO over 8–15 m. Across the full auger package, 35 of 139 holes—one in four—
averaged at least 4,000 ppm TREO (0.40% TREO) over a combined 300 m.
- Heavy rare-earth oxides accompany high-grade TREO: MAV_RC_0012 returned 5 m at 566 ppm HREO,
including 100 ppm DyTb, while MAV_RC_0005 returned 5 m at 430 ppm HREO, including 91 ppm DyTb.
The 272 assayed RC metres average 145.5 ppm HREO, including 29.8 ppm DyTb.
- Elevated grades at current depth limits: six of the seven RC holes returned more than 4,000 ppm TREO in
their final assayed metre, identifying clear targets for deeper follow-up drilling.
- Cumulative scale: reported assay drilling at Minas Americas now stands at 443 holes and 3,628.8 m
The 4,000 ppm and 7,000 ppm thresholds are used only to summarize assay results and are not mineral-resource cut-off grades or economic thresholds.
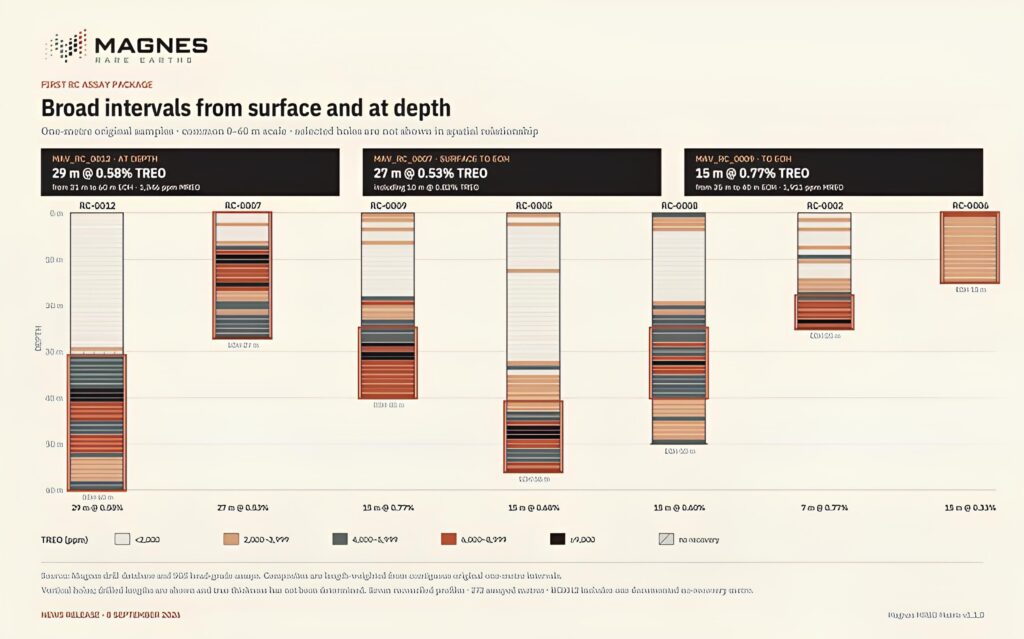
Figure 1. TREO head grade by drilled depth for the seven RC holes reported in this release. Each column uses a common 0–60 m vertical scale.
Highlighted outlines identify selected length-weighted composites of contiguous, original one-metre samples. The hatched interval in MAV_RC_0012 denotes a documented no-recovery interval. Holes are arranged for comparison and are not shown in spatial relationship.
Why These Results Matter
The first RC assays materially extend the drill-derived dataset below auger depths. In MAV_RC_0012, the 29 m lower interval below the documented no-recovery gap averages 5,751 ppm TREO and 1,346 ppm MREO to 60 m—more than eight times the TREO grade and ten times the MREO grade of the upper 30 assayed metres.
Five of seven RC holes returned elevated intervals to EOH and six ended above 4,000 ppm TREO in their final assayed metre, creating specific deeper-drilling targets. Comparable grades below current EOH depths and continuity between holes remain untested.
Why the Magnet-Rare-Earth Basket Matters
Neodymium, praseodymium, dysprosium and terbium—the four oxides in MREO—are used in high-performance permanent magnets. The International Energy Agency’s 2026 Rare Earth Elements report estimates that permanent magnets account for approximately 95% of global rare-earth consumption by value and that demand for these four elements is set to grow by a further one-third by 2030 under current policy settings.
Minas Americas assays quantify all four magnet oxides. Across 272 assayed RC metres, MREO averages 828 ppm, or 22.8% of TREO, led by 798 ppm NdPr with 29.8 ppm DyTb. MAV_AD_0375 averages 2,830 ppm MREO (0.28%); the two deep five-metre RC intervals average 2,315 ppm and 2,429 ppm MREO.
Earlier leach tests indicated ionic adsorption behaviour. These results are head grades and do not establish desorbability or recovery. Representative drill-based metallurgical testwork is the next major test of how the magnet-oxide grades may translate into a recoverable product.
Heavy Rare-Earth Oxides: The Dysprosium–Terbium Magnet Subset
Beyond the strong TREO and MREO results, the assays quantify a distinct heavy rare-earth component. MAV_RC_0012 returned 5 m from 38 m to 43 m averaging 566 ppm HREO, including 100 ppm combined Dy2O3 and Tb4O7, within the interval grading 9,106 ppm TREO and 2,315 ppm MREO. MAV_RC_0005 returned 5 m from 46 m to 51 m at 430 ppm HREO, including 91 ppm DyTb; MAV_RC_0002 returned 7 m from 18 m to EOH at 357 ppm HREO, including 69 ppm DyTb; and MAV_AD_0375 returned 15 m from surface to EOH at 322 ppm HREO, including 79 ppm DyTb.
| Selected September intervals · length-weighted head grades · ppm oxide equivalent |
| HEAVY RARE-EARTH OXIDES · 8 SEPTEMBER 2026 |
Heavy rare-earth oxides were present in the final assayed metre of every RC hole, ranging from 118 ppm to 345 ppm HREO and from 26 ppm to 75 ppm DyTb. These end-of-hole assays strengthen the rationale for deeper follow-up, but do not establish grade continuity below the current hole limits. Across all 272 assayed RC metres, HREO averages 145.5 ppm, including 29.8 ppm DyTb.
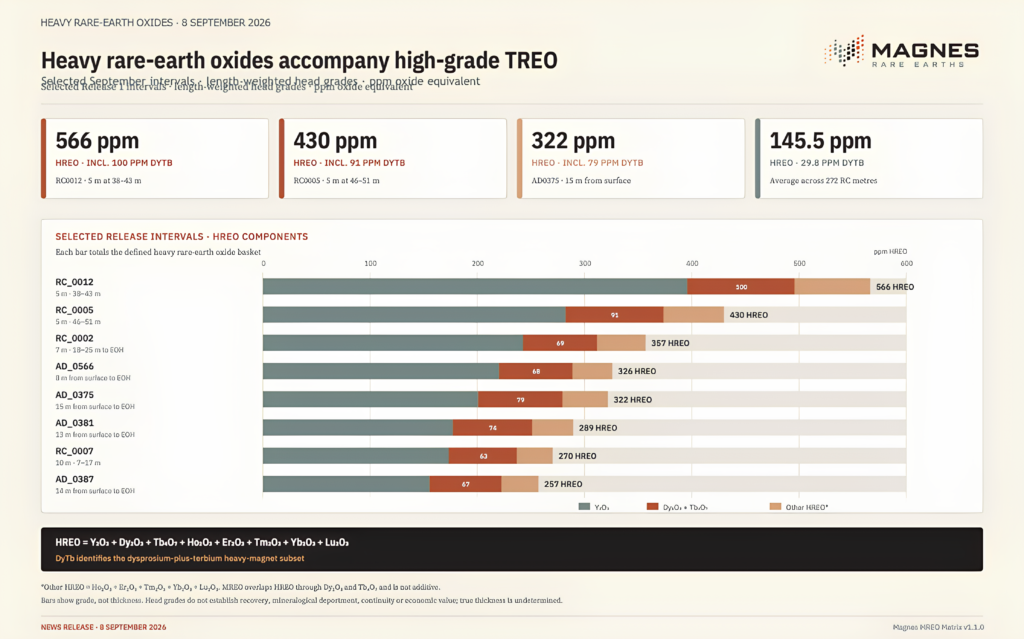
Figure 2. Heavy rare-earth oxide head grades in selected auger and RC intervals reported in this release. Stacked bars partition HREO into Y2O3, combined Dy2O3 and Tb4O7, and the remaining defined heavy rare-earth oxides. Bar length represents grade, not interval thickness. These are head-grade assays and do not establish recovery, mineralogical deportment, continuity or economic value.
For this release, HREO is defined as the sum of Y2O3, Dy2O3, Tb4O7, Ho2O3, Er2O3, Tm2O3, Yb2O3 and Lu2O3. DyTb is the combined Dy2O3 and Tb4O7 heavy-magnet subset. MREO overlaps HREO through Dy2O3 and Tb4O7 and the two metrics are not additive. Representative metallurgical testing is required to determine recoverability.
| Hole |
From (m) |
To (m) |
Interval (m) |
TREO (ppm) |
TREO (%) |
MREO (ppm) |
MREO/TREO |
NdPr (ppm) |
DyTb (ppm) |
| MAV_AD_0375 |
0 |
15 EOH |
15 |
11,480 |
1.15% |
2,830 |
24.7% |
2,752 |
79 |
| MAV_AD_0381 |
0 |
13 EOH |
13 |
9,380 |
0.94% |
2,555 |
27.2% |
2,481 |
74 |
| MAV_AD_0387 |
0 |
14 EOH |
14 |
8,930 |
0.89% |
2,275 |
25.5% |
2,208 |
67 |
| MAV_AD_0566 |
0 |
8 EOH |
8 |
8,565 |
0.86% |
1,999 |
23.3% |
1,930 |
68 |
| MAV_AD_0418 |
0 |
6 EOH |
6 |
6,627 |
0.66% |
1,601 |
24.2% |
1,547 |
55 |
| MAV_AD_0447 |
0 |
14 EOH |
14 |
6,195 |
0.62% |
1,390 |
22.4% |
1,343 |
47 |
Table 1 presents selected full-hole, from-surface auger composites. Complete hole-level results and drill-collar information for the holes reported in this release will be set out in the accompanying Minas Americas Drill-Hole and Assay Results Annex — 8 Sep 2026.
| Hole |
From (m) |
To (m) |
Interval (m) |
TREO (ppm) |
TREO (%) |
MREO (ppm) |
MREO/TREO |
NdPr (ppm) |
DyTb (ppm) |
| MAV_RC_0012* |
0 |
30 |
30 |
705 |
0.07% |
131 |
18.6% |
125 |
6 |
| MAV_RC_0012* |
31 |
60 EOH |
29 |
5,751 |
0.58% |
1,346 |
23.4% |
1,294 |
52 |
| including |
31 |
45 |
14 |
6,636 |
0.66% |
1,561 |
23.5% |
1,495 |
66 |
| including |
38 |
43 |
5 |
9,106 |
0.91% |
2,315 |
25.4% |
2,215 |
100 |
| MAV_RC_0007 |
0 |
27 EOH |
27 |
5,258 |
0.53% |
1,207 |
23.0% |
1,164 |
43 |
| including |
7 |
17 |
10 |
8,215 |
0.82% |
1,969 |
24.0% |
1,906 |
63 |
| MAV_RC_0009 |
0 |
40 EOH |
40 |
4,295 |
0.43% |
1,004 |
23.4% |
970 |
33 |
| including |
25 |
40 EOH |
15 |
7,744 |
0.77% |
1,911 |
24.7% |
1,851 |
60 |
| MAV_RC_0005 |
0 |
56 EOH |
56 |
2,971 |
0.30% |
655 |
22.0% |
630 |
24 |
| including |
41 |
56 EOH |
15 |
6,750 |
0.68% |
1,675 |
24.8% |
1,616 |
59 |
| including |
46 |
51 |
5 |
9,191 |
0.92% |
2,429 |
26.4% |
2,337 |
91 |
| MAV_RC_0008 |
0 |
50 EOH |
50 |
3,502 |
0.35% |
810 |
23.1% |
782 |
29 |
| including |
25 |
40 |
15 |
6,018 |
0.60% |
1,450 |
24.1% |
1,400 |
50 |
| MAV_RC_0002 |
0 |
25 EOH |
25 |
3,763 |
0.38% |
847 |
22.5% |
817 |
30 |
| including |
18 |
25 EOH |
7 |
7,652 |
0.77% |
1,898 |
24.8% |
1,829 |
69 |
| MAV_RC_0006 |
0 |
15 EOH |
15 |
3,255 |
0.33% |
741 |
22.8% |
716 |
25 |
Note: The asterisk identifies MAV_RC_0012, for which assay coverage comprises 0–30 m and 31–60 m. The 30–31 m interval was not recovered and therefore has no assay result. No composite crosses the gap. Table 2 intervals are length-weighted averages of contiguous, original one-metre samples. Complete results and drill-collar information for the holes reported in this release will be set out in the accompanying Minas Americas Drill-Hole and Assay Results Annex — 8 Sep 2026.
Reported Drilling Recap
| Reporting period |
Drill type |
Holes |
Assayed metres |
| Reported before this release |
Auger |
297 |
2,329.8 |
| Present release |
Auger |
139 |
1,027.0 |
| Present release |
RC |
7 |
272.0 |
| Present release subtotal |
Auger + RC |
146 |
1,299.0 |
| Cumulative reported total |
Auger + RC |
443 |
3,628.8 |
The previously reported total comprises 44 initial auger holes totalling 473.8 m and 253 additional auger holes totalling 1,856 m announced on 16 June 2026. Each hole is counted once. The RC metre total counts original drill intervals for which assays are reported; the documented one-metre no-recovery interval in MAV_RC_0012 is excluded.
Minas Americas Project Background
Minas Americas is an exploration-stage clay-hosted rare earth project across 13 mineral rights in Minas Gerais, Brazil. Surface and trench sampling returned up to 8,930 ppm TREO and 2,182 ppm MREO before drilling commenced. Initial leach tests indicated ionic adsorption behaviour, with up to 667 mg/kg desorbable rare earth oxides (“DREO”) and up to 278 mg/kg MREO in primary leach solution.
Initial drilling results were announced on 2 December 2025, followed on 26 January 2026 by a 13 m interval at 0.83% TREO, including 8 m at 1.01% TREO. On 16 June 2026, Magnes reported assays from 253 additional holes and 1,856 m, led by MAV_AD_0200, which returned 10 m from surface at 9,736 ppm TREO and 2,407 ppm MREO. That release brought the previously reported total to 297 holes and 2,329.8 m.
From Shallow Discovery to Three-Dimensional Definition
With 443 holes and 3,628.8 m of reported assays, Minas Americas is progressing from a shallow auger discovery toward three-dimensional geological definition. The first RC results materially increase the vertical range of the dataset, identify priority targets below current EOH depths and provide drill-derived material to support representative metallurgical composite selection.
Minas Americas has no mineral resource, mineral reserve, project economics or development decision. The next value-defining questions are whether deeper and follow-up drilling reproduces the elevated intervals, how the shallow and deeper profiles connect in the geological model and how representative mineralized material performs in controlled metallurgical testwork.
Next Milestones
Planned workstreams include:
— integrating the expanded auger and RC assay dataset into the three-dimensional geological model;
— priority follow-up RC drilling around the principal broad, higher-grade intervals and beneath selected holes with elevated TREO in their final assayed metre;
— selecting representative drill-based composites and advancing metallurgical testwork;
— continued resource-definition and step-out drilling, with additional holes reported only after assay coverage has been completed or reconciled and the applicable QA/QC review has been closed;
— publication of maiden S-K 1300 and NI 43-101 mineral resource estimates before the end of 2026, subject to drilling results, assay turnaround, technical work and regulatory review;
— publication of a preliminary economic assessment in H1 2027, subject to completion of the required resource, metallurgical, engineering and economic work; and
— continued strategic development and capital-markets preparation for Magnes, including the intended U.S. listing process if conditions and approvals support it.
Technical Notes
Assays are reported as head grades in ppm. 10,000 ppm equals 1.0%. TREO means the sum of the oxides of lanthanum through lutetium plus yttrium. MREO means the sum of Nd2O3, Pr6O11, Dy2O3 and Tb4O7. HREO means the sum of Y2O3, Dy2O3, Tb4O7, Ho2O3, Er2O3, Tm2O3, Yb2O3 and Lu2O3. NdPr means the sum of Nd2O3 and Pr6O11. DyTb means the sum of Dy2O3 and Tb4O7. MREO and HREO overlap through Dy2O3 and Tb4O7 and are not additive. DREO, where prior leach testing is referenced, means desorbable rare earth oxides.
Selected composites are length-weighted averages of contiguous, original one-metre drill-interval samples. Summary calculations use head-grade assay values. For calculation purposes, values reported below a detection limit were assigned one-half of that limit, while values reported above an upper reporting limit were assigned the stated limit. Rounding may result in minor differences.
Auger and RC samples represent one-metre drilled intervals. Drill-interval calculations exclude QA/QC, duplicate and other control samples.
All reported auger and RC holes were drilled vertically, with a dip of −90°; azimuth is not applicable to vertical holes. Reported intervals are drilled lengths; true thickness has not been determined. Collar coordinates, elevations and EOH depths will be set out in the accompanying Minas Americas Drill-Hole and Assay Results Annex
— 8 Sep 2026. Spatial coordinates are referenced to the SIRGAS 2000 geodetic datum and projected using the Universal Transverse Mercator (UTM) coordinate system, Zone 23S.
Six of the seven RC holes have continuous assay coverage from surface to EOH. MAV_RC_0012 contains a documented no-recovery interval from 30 m to 31 m. No composite crosses that interval. Every included hole record has been reconciled to its recorded EOH. Incomplete holes and holes subject to an unresolved QA/QC hold are excluded from this release.
QA/QC
Auger and RC samples were submitted to SGS Geosol Laboratórios S.A. in Vespasiano, Minas Gerais, Brazil, a
third-party commercial laboratory external to Magnes and Verde. Analyses used lithium-borate fusion followed by ICP-MS/OES determination for rare earth and oxide analysis. Magnes’ quality assurance and quality control procedures include the regular insertion of blanks, certified reference materials and field duplicates into the sample stream. Laboratory repeat and duplicate analyses were performed by SGS.
The Qualified Person verified the sampling, analytical and test data supporting this disclosure by reconciling drill-hole, interval, sample and batch identifiers between the field database and laboratory records; comparing analytical values, methods, units and qualifiers with the laboratory records; independently recalculating selected oxide totals and length-weighted composites; and reviewing the applicable blanks, certified reference materials, field duplicates and laboratory controls. No material discrepancies or limitations were identified during this verification. Based on the procedures performed and results obtained, the Qualified Person considers the underlying data reliable and suitable for disclosure of exploration results. QA/QC and control samples are excluded from public assay-result tables unless specifically discussed for QA/QC purposes.
Qualified Person
The scientific and technical information contained in this news release has been reviewed and approved by Carlos Leite, MAusIMM CP(Geo) (No. 1006695), an independent consultant to Magnes and a Qualified Person as defined by National Instrument 43-101 — Standards of Disclosure for Mineral Projects.
About Magnes Rare Earths
Magnes Rare Earths was created as a wholly owned subsidiary of Verde AgriTech Ltd. to hold and advance the Minas Americas Global Alliance Project in Minas Gerais, Brazil. Magnes is intended to serve as Verde’s dedicated rare earths platform and, subject to market conditions and applicable approvals, pursue a future listing on a U.S. stock exchange.
About Verde AgriTech
Verde AgriTech is a Brazil-focused specialty fertilizer company listed on the TSX and OTCQX. Through its wholly owned subsidiary Magnes Rare Earths, the Company also retains exposure to the Minas Americas Global Alliance rare earth project in Minas Gerais, Brazil.
For Additional Information
Website: magnesrareearths.com
Investor relations: magnesrareearths.com/contact?topic=investor#enquiry
Register for Magnes investor updates: magnesrareearths.com/investors#updates
Forward-Looking Statements
This news release contains forward-looking information and forward-looking statements within the meaning of applicable securities laws. These include statements regarding the significance and interpretation of exploration results; the potential continuity, geometry, extent and depth of mineralization; whether mineralization continues below current EOH depths; geological modelling and target ranking; follow-up, step-out and resource-definition drilling; receipt, validation and reporting of additional assays; representative composite selection, metallurgical testwork and technical studies; the potential timing and publication of S-K 1300 and NI 43-101 mineral resource estimates and a preliminary economic assessment; the potential pursuit of a U.S. stock exchange listing for Magnes; and Magnes’ and Verde’s plans, objectives and expectations.
Forward-looking statements are based on management’s current expectations, estimates, interpretations and assumptions, including the accuracy and representativeness of sampling and assay data; the potential continuity of mineralization; the availability of drilling equipment, laboratories, qualified personnel and financing; timely receipt of required permits and approvals; and technical work progressing as presently anticipated. Forward-looking statements involve risks and uncertainties that may cause actual results or events to differ materially, including exploration-stage risk, assay and metallurgical variability, geological interpretation and continuity risk, sampling and QA/QC risk, mineral-right and permitting risk, commodity-market and financing risk, regulatory and exchange approvals, market conditions and other risks described in the Company’s continuous-disclosure filings.
No mineral resource estimate, mineral reserve estimate, production guidance, project-level economic assessment, recovery estimate or development decision is provided in this release. There is no certainty that further exploration will delineate mineral resources or mineral reserves, that metallurgical testwork will demonstrate economic recoveries, or that a development decision will be made. Readers should not place undue reliance on forward-looking statements. Forward-looking statements speak only as of the date of this news release. Magnes and Verde do not undertake to update them except as required by applicable securities laws.
Source: International Energy Agency, Rare Earth Elements (2026), https://www.iea.org/reports/rare-earth-elements.
Belo Horizonte, Brazil and Singapore, August 13, 2026 – Verde AgriTech Ltd (TSX: NPK | OTCQX: VNPKF) (“Verde” or the “Company”) today reported its financial and operating results for the three and six months ended June 30, 2026 (“Q2 2026”).
“Q2 2026 was marked by greater selectivity in fertilizer purchasing across Brazilian agriculture. The underlying need for crop nutrition remained, but fertilizer affordability, restrictive financing and the expected return on each application increasingly shaped the timing and scope of purchasing decisions. In this environment, our focus is to understand customer priorities more precisely, direct our efforts toward the most relevant opportunities and shorten the path from technical validation to commercial adoption,” stated Reberth Machado, Chief Executive Officer of Verde.
“Closer customer engagement is central to that approach. Since becoming CEO, my priority has been to engage directly with Verde’s major clients, strategic B2B customers, and well-renowned agronomic advisers across Brazil. We are also seeking a stronger presence at major industry events, particularly in Sugarcane, where I bring extensive operating experience and longstanding relationships, and in composting-related segments, where our products have synergistic fit. These discussions are sharpening how we prioritize accounts, deploy commercial resources, and develop new business, with clear criteria for pricing, credit and resource allocation,” Mr. Machado added.
Second Quarter 2026 Financial Highlights
All figures are in Canadian dollars unless otherwise stated.
- Revenue in Q2 2026 was $3.4 million compared with $4.8 million in Q2 2025 and sales volume totaled 46,709 tons in Q2 2026 compared with 80,354 tons in Q2 2025. Excluding product delivery freight revenue, average revenue per ton increased to $40 from $38.
- Unit profitability remained resilient, with average gross profit per ton, excluding product delivery freight revenue, increasing to $23 from $22 in Q2 2025, even in a lower-volume environment.
- Sales and marketing and general and administrative expenses decreased by 10% in Q2 2026 compared with Q2 2025.
- EBITDA before non-cash events was $(1.2) million in Q2 2026 compared with $(0.2) million in Q2 2025.
- Net loss was $(3.6) million in Q2 2026 compared with a net loss of $(2.4) million in Q2 2025.
- As of June 30, 2026, the Company held $4.1 million in cash and $5.7 million in short-term receivables, compared with $2.4 million and $8.2 million, respectively, as of June 30, 2025.
Q2 2026 Sustainability Results
In Q2 2026, products sold by Verde had the potential to capture up to 5,605 tons of CO₂ through Enhanced Rock Weathering, with estimated net carbon removal of 3,937 tons, while also avoiding an estimated 2,336 tons of CO₂e emissions by replacing potassium chloride fertilizers. Since production began in 2018, the combined potential net carbon removal and avoided emissions total approximately 348,790 tons of CO₂. Additionally, 3,698 tons of chloride were prevented from entering soils in Q2 2026, bringing the cumulative total avoided since inception to approximately 198,132 tons.
Magnes Rare Earths and Minas Americas Highlights
During Q2 2026, Verde established Magnes Rare Earths as a wholly owned platform dedicated to advancing the Minas Americas Global Alliance project, preserving Verde shareholders’ exposure while providing focused technical and capital markets leadership. On June 16, Magnes reported assays from 253 additional drill holes, bringing the total reported to 297. The update included 10.0 metres from surface at 0.97% TREO and reinforced the repetition of shallow mineralization with an NdPr-led magnet rare earth basket and Dy/Tb support[1].
Magnes is integrating the expanded dataset into geological modelling and metallurgical testwork. Subject to technical, financing and regulatory conditions, it is targeting maiden S-K 1300 and NI 43-101 mineral resource estimates before year-end 2026 and a preliminary economic assessment in H1 2027. Magnes also intends to pursue a future U.S. stock exchange listing, subject to applicable approvals and market conditions. The assays are head grades and do not represent recoverable grades, mineral resources, mineral reserves or project economics. Leonardo Deringer Fraga, P.Geo., an independent Qualified Person under NI 43-101, has reviewed and approved the scientific and technical information in this release (EGBC Licence No. 61611).
Brazil’s rare earth policy backdrop also became more constructive. In June, the Ministry of Mines and Energy published a study supporting the preparation of a National Rare Earths Strategy.[2] In July, the Ministry approved the National Mining Plan 2050 through Portaria MME No. 924/2026.[3] The Chamber of Deputies also approved Bill 2,780/2024, which would establish a national policy for critical and strategic minerals, and sent it to the Federal Senate for consideration.[4]
Fertilizer Market Conditions
Brazil’s agricultural input market remained under significant financial pressure in Q2 2026. The principal constraint was access to credit and working capital, which led growers, distributors and cooperatives to preserve cash, reduce commitments, and defer fertilizer purchases.
The Central Bank of Brazil reduced the Selic rate to 14.25% in June and further to 14.00% after quarter-end in August. Financing costs nevertheless remained elevated throughout Q2, and the easing implemented during the quarter had not yet translated into a broad improvement in credit availability by quarter-end.[5]
Sector credit quality also deteriorated. At the end of June 2026, a record 1,263 Brazilian agricultural businesses were in judicial reorganization, 66% more than at the end of June 2025. This increase reflected persistent financial stress across the sector, as growers, distributors and other participants across the agricultural value chain continued to face constrained liquidity, high financing costs and weaker cash generation.[6]
The pressure was visible in the 2026/27 fertilizer buying cycle. By late May, Brazilian soybean growers had secured approximately 50% of expected fertilizer requirements, compared with more than 60% historically.[7] Customers shortened buying windows and, in some cases, reducing purchases, limiting visibility over the timing and conversion of demand.
The 2026 election year added a further planning variable. As the October presidential election approached, uncertainty over the post-election fiscal and interest-rate outlook remained in focus, while El Niño forecasts increased the risk of regional changes in planting and nutrient-application windows.[8] Together, restricted credit, elevated sector insolvencies and political and climate uncertainty kept commercial conditions difficult throughout the quarter. For Verde, these conditions required continued discipline in credit approval, pricing and account selection.
Q2 2026 FINANCIAL RESULTS
The following table provides information about the three and six months ended June 30, 2026, compared with the three and six months ended June 30, 2025.
| All amounts in CAD $’000, except per-ton data and percentages |
3 months ended
June 30, 2026 |
3 months ended
June 30, 2025 |
6 months ended
June 30, 2026 |
6 months ended
June 30, 2025 |
| Tons sold (‘000) |
47 |
80 |
74 |
128 |
| Average revenue per ton sold $ |
73 |
60 |
69 |
60 |
| Average production cost per ton sold $ |
(17) |
(16) |
(20) |
(16) |
| Average gross profit per ton sold $ |
56 |
44 |
49 |
44 |
| Average gross margin |
77% |
73% |
71% |
73% |
| |
|
|
|
|
| Revenue |
3,425 |
4,800 |
5,102 |
7,652 |
| Production costs |
(816) |
(1,316) |
(1,458) |
(2,073) |
| Gross Profit |
2,609 |
3,484 |
3,644 |
5,579 |
| Gross Margin |
77% |
73% |
71% |
73% |
| Sales and marketing expenses |
(751) |
(891) |
(1,478) |
(1,742) |
| Product delivery freight expenses |
(1,559) |
(1,733) |
(2,184) |
(2,848) |
| General and administrative expenses |
(1,003) |
(1,048) |
(2,036) |
(2,098) |
| Allowance for expected credit losses |
(518) |
6 |
(542) |
(507) |
| EBITDA (1) |
(1,222) |
(182) |
(2,596) |
(1,616) |
| Share-Based, Equity and Bonus Payments (Non-Cash Event) (2) |
(34) |
(72) |
(102) |
(233) |
| Depreciation and Amortization (3) |
(862) |
(772) |
(1,684) |
(1,546) |
| Operating (Loss) / Profit after non-cash events |
(2,118) |
(1,026) |
(4,382) |
(3,395) |
| Interest Income/Expense |
(1,514) |
(1,394) |
(2,978) |
(2,802) |
| Net (Loss) / Profit before tax |
(3,632) |
(2,420) |
(7,360) |
(6,197) |
| Income tax |
(5) |
(6) |
(6) |
(10) |
| Net (Loss) / Profit |
(3,637) |
(2,426) |
(7,366) |
(6,207) |
(1) Non-GAAP measure. EBITDA before non-cash events is calculated as operating loss before depreciation, amortization and non-cash events. Refer to the section entitled “Non-GAAP and Other Financial Measures” below.
(2) Included within General and Administrative expenses in the financial statements.
(3) Included within General and Administrative expenses and Cost of Sales in the financial statements.
Sales Performance
Revenue for Q2 2026 was $3.4 million compared with $4.8 million in Q2 2025. The decline reflected lower volume as customers shortened buying windows and, in some cases, reassessed planting expansion and planned nutrient applications in response to tighter liquidity and weaker crop economics. Verde continued to apply selective credit criteria, particularly for specialty fertilizer sales that include third-party raw materials and did not extend higher-risk terms without adequate compensation.
Looking beyond the current buying cycle, tighter global grain balances could provide a more constructive backdrop for grower economics. Reuters reported that global wheat and corn output for 2026/27 is projected to fall short of consumption, reducing the supply cushion.[9] If this supports firmer crop prices and stronger grower cash generation, management believes fertilizer purchasing capacity and Verde’s order conversion could begin to improve during H1 2027[10].
Gross profit
Gross profit was $2.6 million in Q2 2026 compared with $3.5 million in Q2 2025, reflected by lower sales volume. Excluding product delivery freight revenue, average revenue per ton was $40 compared with $38, while average production cost per ton was $17 compared with $16. Despite the lower sales volume and the fixed nature of a significant portion of production costs, the Company maintained unit profitability broadly in line with the prior year, with average gross profit per ton of $23 compared with $22 and gross margin of 57% compared with 58%.
Sales, general and administrative expenses
Sales, general and administrative expenses decreased by 10% to $1.75 million in Q2 2026, compared with $1.94 million in Q2 2025. These reductions are related to supplier contract reviews, contract renegotiations, workforce reductions, and tighter discretionary-spend controls, showing that proactive actions were taken, given the current market conditions.
Allowance for expected credit losses
The Company recognized an expected credit loss expense of $0.5 million in Q2 2026, compared with a nominal recovery in Q2 2025. The charge primarily related to trade receivables from a customer that entered judicial reorganization in Brazil during the quarter.
Financial Results and Profitability
EBITDA before non-cash events for Q2 2026 was $(1.2) million compared with $(0.2) million in Q2 2025. Lower gross profit and the expected credit loss charge were partly offset by lower sales and marketing, freight and administrative expenses.
Net loss for Q2 2026 was $(3.6) million compared with $(2.4) million in Q2 2025. Net finance expense was $(1.5) million compared with $(1.4) million, reflecting the continued effect of elevated interest rates.
Basic and diluted loss per share was $(0.064) in Q2 2026 compared with $(0.046) in Q2 2025.
Liquidity, Debt and Working Capital
As of June 30, 2026, the Company held $4.1 million in cash and $5.7 million in short-term receivables. Total loan balance was $55.1 million, of which $6.8 million was due within 12 months and $48.3 million was due thereafter, with an average interest rate of 16.25% per annum.
The Company ended Q2 2026 with working capital of $1.7 million. Current liabilities were $10.0 million compared with $3.5 million as of June 30, 2025, primarily reflecting the reclassification of borrowings into current liabilities as repayments became due. The applicable repayment terms are under renegotiation.
Q2 2026 Financial Results Conference Call
The Company will host a conference call to discuss Q2 2026 results and provide an update. Subscribe using the link below and receive the conference details by email.
The Company’s financial statements and related notes for the period ended June 30, 2026, are available to the public on SEDAR+ at www.sedarplus.ca and the Company’s website at www.investor.verde.ag/.
About Verde AgriTech
Verde AgriTech is a Brazil‑focused specialty fertilizer company listed on the TSX and OTCQX. Through its wholly owned subsidiary Magnes Rare Earths, the Company also retains exposure to the Minas Americas Global Alliance rare earth project in Minas Gerais, Brazil. For more information on how we are leading the way towards sustainable agriculture and climate change mitigation in Brazil, visit our website at https://verde.ag/en/home/.
For additional information please contact:
Investor Relations
Tel: +55 (31) 3245 0205; Email: investor@verde.ag
www.verde.ag | www.investor.verde.ag
Non-GAAP and Other Financial Measures
Earnings before interest, taxes, depreciation and amortization (“EBITDA”) is not a generally accepted measure of financial performance under IFRS. Management of the Company utilizes EBITDA as a financial performance measure to assess profitability and return on equity in its decision-making. In addition, the Company, its lenders and investors use EBITDA to measure performance and value for various purposes. Investors are cautioned, however, that EBITDA should not be construed as an alternative to net loss attributable to common shareholders determined in accordance with IFRS as an indicator of the Company’s performance.
The Company’s method of calculating EBITDA may differ from other companies and, accordingly, they may not be comparable to similarly named measures used by other companies. A quantitative reconciliation of EBITDA is included below.
| Adjusted EBITDA Reconciliation |
3 months ended
June 30, 2026 |
3 months ended
June 30, 2025 |
6 months ended
June 30, 2026 |
6 months ended
June 30, 2025 |
| Net loss |
(3,637) |
(2,426) |
(7,366) |
(6,207) |
| Add (Deduct): |
|
|
|
|
| Interest Income/Expense |
1,514 |
1,394 |
2,978 |
2,802 |
| Income tax |
5 |
6 |
6 |
10 |
| Share-Based, Equity and Bonus Payments (Non-Cash Event) |
34 |
72 |
102 |
233 |
| Depreciation and Amortization |
862 |
772 |
1,684 |
1,546 |
| Adjusted EBITDA |
(1,222) |
(182) |
(2,596) |
(1,616) |
|
|
|
|
|
|
(1) Refer to “Non-GAAP and Other Financial Measures” section of MD&A for discussion of non-IFRS measures used in this table.
Cautionary Language Regarding Forward-Looking Statements and Other Advisories
Forward-Looking Information and Forward-Looking Statements
This news release contains “forward-looking information” within the meaning of applicable Canadian securities laws and “forward-looking statements” within the meaning of the United States Private Securities Litigation Reform Act of 1995 (collectively, “forward-looking statements”). Forward-looking statements are made as of the date of this news release and relate to future events or performance. Often, but not always, forward-looking statements can be identified by words such as “expects,” “anticipates,” “plans,” “projects,” “estimates,” “envisages,” “assumes,” “intends,” “strategy,” “goals,” “objectives,” or variations (including negative variations) of such words and phrases, or statements that certain actions, events or results “may,” “could,” “would,” “might,” or “will” be taken, occur or be achieved.
Forward-looking statements in this news release include, without limitation, statements regarding: (i) the potential amount and timing of carbon removal and avoided emissions associated with Verde’s products; (ii) the customer-led commercial strategy under Reberth Machado, including customer engagement, account prioritization and conversion; (iii) Magnes Rare Earths, continued drilling, geological modelling, metallurgical testwork, the potential timing and publication of S-K 1300 and NI 43-101 mineral resource estimates, a preliminary economic assessment and a possible future U.S. stock exchange listing; (iv) agricultural credit conditions, fertilizer affordability, demand and Verde’s competitive position; and (v) the liquidity-preservation and creditor-engagement strategy, including payment suspensions and efforts to obtain waivers, standstill arrangements, amendments, extensions or other revised terms.
These forward-looking statements are based on management’s current expectations, estimates and assumptions as of the date hereof, including, without limitation: customer demand and purchasing behavior; the availability and cost of agricultural credit; the effectiveness of commercial initiatives; the presence and continuity of mineralization; the representativeness of assay results; the availability of equipment, laboratories, personnel and financing; metallurgical performance; receipt of required corporate, regulatory, exchange and shareholder approvals; foreign exchange rates; realized selling prices; market adoption of Verde’s products; and the Company’s ability to negotiate sustainable terms with creditors.
Forward-looking statements are inherently subject to known and unknown risks, uncertainties and other factors that may cause actual results to differ materially from those expressed or implied. These include, without limitation: agricultural credit constraints; grower, distributor or cooperative insolvencies; customer concentration and collection risk; failure to execute the customer-led commercial strategy; leadership-transition and key-person risks; lower-than-expected demand, prices, margins or cash conversion; foreign-exchange and interest-rate volatility; debt defaults, creditor notices, claims or proceedings and failure to obtain acceptable revised terms; going-concern and financing risks; exploration, geological, sampling, assay, QA/QC and metallurgical variability; the possibility that exploration will not result in mineral resources or reserves; delays or adverse outcomes in technical studies, permitting, financing or a potential U.S. listing; changes in commodity markets, regulation or tax regimes; operational, infrastructure, environmental, stakeholder and labour risks; and risks affecting carbon-removal methodologies, measurement, verification, certification, permanence and pricing. Additional risk factors are described in the Company’s most recent Annual Information Form and other continuous disclosure filings on SEDAR+. The foregoing list is not exhaustive, and there can be no assurance that forward-looking statements will prove accurate.
Readers are cautioned not to place undue reliance on forward-looking statements. Except as required by applicable law, the Company disclaims any intention or obligation to update or revise any forward-looking statements, whether as a result of new information, future events or otherwise.
Financial Outlook / Future-Oriented Financial Information
This news release may contain future-oriented financial information or financial outlooks (“FOFI”) within the meaning of applicable securities laws, including expectations regarding liquidity preservation, commercial execution and future operating performance. Such FOFI is provided to describe management’s current expectations and may not be appropriate for other purposes. It is based on the assumptions and subject to the risks described above, and actual results may vary materially. This release does not provide rare earth production guidance, recovery guidance, project economics or a development decision.
Currency, Units and Trademarks
Unless otherwise stated, all figures are in Canadian dollars (C$). Tonnages are metric tons.
Third Party Sources
This news release contains information concerning the Company’s industry and the markets in which it operates, which is based on information from independent third-party sources. Although management of the Company believes these sources to be generally reliable, market and industry data is inherently imprecise, subject to interpretation and cannot be verified with complete certainty due to limits on the availability and reliability of raw data, the voluntary nature of the data gathering process, and other limitations and uncertainties inherent in any statistical survey or data collection process. Management of the Company has not independently verified any third-party information contained herein.
Consolidated Statement of Profit or Loss[11]
For the three and six months ended 30 June 2026
All amounts expressed in Canadian dollars.
|
3 Months ended
30 June 2026
$’000 |
3 Months ended
30 June 2025
$’000 |
6 Months ended
30 June 2026
$’000 |
6 Months ended
30 June 2025
$’000 |
| Revenue |
3,425 |
4,800 |
5,102 |
7,652 |
| Cost of sales |
(1,638) |
(2,049) |
(3,063) |
(3,541) |
| Gross Profit |
1,787 |
2,751 |
2,039 |
4,111 |
|
| Sales and distribution expenses |
(2,310) |
(1,714) |
(3,662) |
(3,680) |
| Administrative expenses |
(1,594) |
(2,063) |
(2,758) |
(3,826) |
| Operating (Loss) / Profit |
(2,117) |
(1,026) |
(4,381) |
(3,395) |
|
| Finance income |
108 |
60 |
187 |
133 |
| Finance costs |
(1,623) |
(1,454) |
(3,166) |
(2,935) |
| Loss before tax from continuing operations |
(3,632) |
(2,420) |
(7,360) |
(6,197) |
|
| Income tax expense |
(5) |
(6) |
(6) |
(10) |
| Loss for the period |
(3,637) |
(2,426) |
(7,366) |
(6,207) |
| Loss per share ($) |
3 Months ended
30 June 2026 |
3 Months ended
30 June 2025 |
6 Months ended
30 June 2026 |
6 Months ended
30 June 2025 |
| Basic and diluted loss per share |
(0.064) |
(0.046) |
(0.131) |
(0.118) |
Consolidated Statement of Financial Position[12]
As at 30 June 2026
All amounts expressed in Canadian dollars.
| Assets |
30 June 2026 |
31 Dec 2025 |
|
($’000) |
($’000) |
| Property, plant and equipment |
42,380 |
39,445 |
| Right-of-use asset |
– |
– |
| Mineral properties |
19,586 |
18,374 |
| Other assets |
435 |
396 |
| Deferred tax asset |
2,848 |
2,595 |
| Total non-current assets |
65,249 |
60,810 |
| Inventory |
1,839 |
1,376 |
| Trade and other receivables |
5,699 |
5,311 |
| Other financial assets |
– |
– |
| Cash and cash equivalents |
4,115 |
2,985 |
| Total current assets |
11,653 |
9,672 |
| Total assets |
76,902 |
70,482 |
| Issued capital |
21,342 |
20,664 |
| Capital contribution |
49,862 |
49,862 |
| Warrants reserve |
3,374 |
– |
| Merger reserve |
(4,557) |
(4,557) |
| Translation reserve |
(14,015) |
(14,924) |
| Accumulated losses |
(37,526) |
(30,262) |
| Total equity |
18,480 |
20,783 |
| Interest-bearing loans and borrowings |
48,316 |
41,997 |
| Lease liabilities |
– |
– |
| Provisions |
139 |
128 |
| Total non-current liabilities |
48,455 |
42,125 |
| Trade and other payables |
3,178 |
2,148 |
| Interest-bearing loans and borrowings |
6,783 |
5,421 |
| Lease liabilities |
– |
– |
| Other financial liabilities |
6 |
5 |
| Total current liabilities |
9,967 |
7,574 |
| Total liabilities |
58,422 |
49,699 |
| Total equity and liabilities |
76,902 |
70,482 |
[1] Read more at: Magnes Rare Earths Reports 10 m From Surface at 0.97% TREO at Minas Americas Rare Earth Project.
[2] Source: Brazilian Ministry of Mines and Energy (MME), “Final Report – Support for the Preparation of the National Rare Earths Strategy” (June 9, 2026).
[3] Sources: Brazilian Ministry of Mines and Energy (MME), “Brazil Establishes a State Strategy to Transform Mineral Wealth into Sustainable Development While Strengthening National Sovereignty Through 2050” (July 2, 2026), and “MME Ordinance No. 924 of July 2, 2026 – Approval of the National Mining Plan 2050” (published in the Federal Official Gazette on July 7, 2026).
[4] Source: Federal Senate of Brazil, “Bill No. 2,780/2024 – National Policy for Critical and Strategic Minerals” (legislative record). As of July 29, 2026, the bill remained under Senate consideration; Urgency Request No. 506/2026 had been received on July 6, 2026.
[5] Sources: Central Bank of Brazil, “Minutes of the Meeting of the Monetary Policy Committee – Copom, 279th Meeting, June 16-17, 2026” and, “Minutes of the Meeting of the Monetary Policy Committee – Copom, 280th Meeting, August 04-05, 2026”
[6] Source: Poder360, “Agribusiness Judicial Reorganizations Reach Record High, Up 66% in One Year” (August 4, 2026), based on the RGF-Bizdoc Monitor.
[7] Source: Reuters, “Soaring fertilizer prices dim Brazilian farmers’ edge over U.S. rivals” (June 8, 2026).
[8] Sources: Reuters, “Brazil’s economy forecast to grow moderately after October presidential vote” (July 13, 2026), and NOAA Climate Prediction Center, “ENSO Diagnostic Discussion” (July 9, 2026).
[9] Source: Reuters – “Big Grain Crops Mask Shrinking Margin for Error” (July 16, 2026). Available at: Reuters article
[10] The timing and extent of any improvement remain uncertain and would depend on a sustained improvement in grower economics.
[11] For important notes and disclosures, please refer to the Company’s Q2 2026 full consolidated financial statements and accompanying notes.
[12] For important notes and disclosures, please refer to the Company’s Q2 2026 full consolidated financial statements and accompanying notes.
Additional assay results from 253 drill holes bring the total number of reported Minas Americas drill holes to 297 and strengthen the shallow, repeated rare earth mineralization model
BELO HORIZONTE, Brazil and SINGAPORE- June 16, 2026 – Magnes Rare Earths (“Magnes”), a wholly owned subsidiary of Verde AgriTech Ltd. (TSX: NPK | OTCQX: VNPKF) (“Verde” or the “Company”) is pleased to report additional head-grade rare earth assay results from the Minas Americas Global Alliance project (“Minas Americas” or the “Project”) in Minas Gerais, Brazil.
The new assay package is highlighted by MAV_AD_0200, which returned 10 m from surface (0-10 m) averaging 9,736 ppm TREO (0.97% TREO) and 2,407 ppm MREO, with MREO representing 24.7% of TREO. The result includes a peak one-metre original sample within the interval of 11,016 ppm TREO from 5 m to 6 m.
With this release, assay results have now been reported from 297 drill holes at Minas Americas, including 253 drill holes in this update.
“The important point in this batch is not one isolated sample,” said Cristiano Veloso, Founder and Chief Executive Officer of Magnes Rare Earths. “It is the repetition of shallow rare earth mineralization across a much larger drill dataset, with the strongest intervals continuing to carry the magnet rare earth oxides that matter most for permanent magnets: neodymium and praseodymium, with dysprosium and terbium support. These results give our technical team a stronger foundation for geological modelling, target ranking and representative metallurgical composite selection.”
Highlights
- Best new selected interval: MAV_AD_0200 returned 10 m from surface at 9,736 ppm TREO (0.97% TREO) and 2,407 ppm MREO, with MREO representing 24.7% of TREO.
- Additional high-grade, from-surface intervals: MAV_AD_0288 returned 10 m at 9,090 ppm TREO and 2,121 ppm MREO; MAV_AD_0299 returned 8 m at 8,998 ppm TREO and 2,327 ppm MREO.
- Peak one-metre TREO sample: sample 1261 in MAV_AD_0116 returned 16,032 ppm TREO (1.60% TREO) and 3,109 ppm MREO from 5 m to 6 m.
- Strongest one-metre magnet rare earth result: sample 1109 in MAV_AD_0115 returned 4,475 ppm MREO and 15,089 ppm TREO, with MREO representing 29.7% of TREO.
- Repetition across the new dataset: 17 hole-level composites returned at least 7,000 ppm TREO over a combined 163 m; 94 returned at least 4,000 ppm TREO over a combined 826 m.
- Magnet rare earth basket: the top 25 selected intervals have a length-weighted average of 7,551 ppm TREO and 1,787 ppm MREO, with MREO representing approximately 23.7% of TREO.
- Scale of reported assay drilling: assay results have now been reported from 297 drill holes at Minas Americas, including 253 drill holes in this release.
Why These Results Matter
The Minas Americas exploration thesis depends on more than individual high-grade samples. The value-relevant question is whether shallow clay-hosted rare earth mineralization repeats across multiple holes with meaningful thickness and a magnet rare earth basket dominated by NdPr, with Dy/Tb support.
The new results strengthen that interpretation. The package includes assay results from 253 drill holes and 1,856 m of original drill interval samples. Across the dataset reported in this release, length-weighted averages are 3,640 ppm TREO and 800 ppm MREO. The highest-grade selected intervals are shallow, with most of the top intervals beginning at surface, and several carry MREO/TREO ratios in the 23%-26% range.
These are head-grade assay results. They should not be interpreted as recoverable rare earth grades, leach recoveries, mineral resources, mineral reserves or project economics. Recoverability and process performance require separate metallurgical testwork and QP review.
Table 1: Selected New Hole-Level Intervals
| Hole |
From
(m) |
To
(m) |
Interval (m) |
TREO (ppm) |
TREO (%) |
MREO (ppm) |
MREO/TREO |
NdPr (ppm) |
DyTb (ppm) |
| MAV_AD_0200 |
0 |
10 |
10 |
9,736 |
0.97% |
2,407 |
24.7% |
2,350 |
56 |
| MAV_AD_0288 |
0 |
10 |
10 |
9,090 |
0.91% |
2,121 |
23.3% |
2,062 |
58 |
| MAV_AD_0299 |
0 |
8 |
8 |
8,998 |
0.90% |
2,327 |
25.9% |
2,249 |
78 |
| MAV_AD_0138 |
0 |
6 |
6 |
8,608 |
0.86% |
2,242 |
26.0% |
2,158 |
84 |
| MAV_AD_0287 |
0 |
6 |
6 |
8,548 |
0.85% |
2,196 |
25.7% |
2,118 |
79 |
| MAV_AD_0237 |
0 |
14 |
14 |
8,527 |
0.85% |
1,954 |
22.9% |
1,893 |
62 |
| MAV_AD_0205 |
0 |
11 |
11 |
8,113 |
0.81% |
1,761 |
21.7% |
1,717 |
44 |
| MAV_AD_0097 |
0 |
8 |
8 |
7,965 |
0.80% |
1,845 |
23.2% |
1,789 |
56 |
| MAV_AD_0077 |
0 |
12 |
12 |
7,927 |
0.79% |
1,811 |
22.8% |
1,752 |
58 |
| MAV_AD_0320 |
0 |
6 |
6 |
7,698 |
0.77% |
2,018 |
26.2% |
1,929 |
90 |
| MAV_AD_0201 |
0 |
12 |
12 |
7,677 |
0.77% |
1,764 |
23.0% |
1,704 |
59 |
| MAV_AD_0236 |
0 |
8 |
8 |
7,654 |
0.77% |
1,868 |
24.4% |
1,800 |
68 |
Table 1 intervals are length-weighted composites of contiguous original drill interval samples. They are selected to show the strongest hole-level TREO intervals in this assay update while retaining magnet rare earth context.
Table 2: Selected Original One-Metre Sample Results
| Sample |
Hole |
From (m) |
To (m) |
TREO (ppm) |
TREO (%) |
MREO (ppm) |
MREO/TREO |
NdPr (ppm) |
DyTb (ppm) |
| 1261 |
MAV_AD_0116 |
5 |
6 |
16,032 |
1.60% |
3,109 |
19.4% |
2,986 |
124 |
| 1109 |
MAV_AD_0115 |
8 |
9 |
15,089 |
1.51% |
4,475 |
29.7% |
4,359 |
116 |
| 1108 |
MAV_AD_0115 |
7 |
8 |
12,007 |
1.20% |
3,589 |
29.9% |
3,483 |
106 |
| 1317 |
MAV_AD_0138 |
0 |
1 |
11,851 |
1.19% |
3,345 |
28.2% |
3,232 |
113 |
| 2730 |
MAV_AD_0299 |
2 |
3 |
11,751 |
1.18% |
2,953 |
25.1% |
2,871 |
82 |
| 2092 |
MAV_AD_0236 |
2 |
3 |
11,657 |
1.17% |
3,017 |
25.9% |
2,896 |
121 |
| 2719 |
MAV_AD_0298 |
2 |
3 |
11,415 |
1.14% |
1,683 |
14.7% |
1,619 |
64 |
| 0976 |
MAV_AD_0077 |
10 |
11 |
11,348 |
1.13% |
2,590 |
22.8% |
2,504 |
86 |
Minas Americas Project Background
Minas Americas was first announced on October 6, 2025, as a district-scale clay-hosted rare earth discovery, including a mineralized zone of approximately 5,500 hectares across 13 mineral rights and surface/trench samples up to 8,930 ppm TREO and 2,182 ppm MREO. The Project was formally named Minas Americas Global Alliance on October 14, 2025, when an accelerated development plan was approved.
On October 21, 2025, ionic adsorption behaviour was reported in initial leach tests, including up to 667 mg/kg DREO and up to 278 mg/kg MREO in primary leach solution. Initial drilling results were reported on December 2, 2025, followed by the January 26, 2026, intercept of 13.0 m at 0.83% TREO, including 8.0 m at 1.01% TREO. On March 17, 2026, additional assay results from 17 drill holes were reported, including MAV_AD_0028, which returned 10.0 m from surface averaging 8,439 ppm TREO and 1,965 ppm MREO, including 5.0 m averaging 11,032 ppm TREO and 2,717 ppm MREO, as the drill-confirmed footprint expanded beyond 3.5 km2.
“Magnes was created to give Minas Americas the dedicated technical, strategic and capital-markets focus that a rare earths project of this scale requires,” added Mr. Veloso. “Our priority is to keep advancing the Project with discipline, strong technical controls and clear disclosure as the dataset grows.”
Strategic Significance
Minas Americas is an exploration-stage rare earths project with no mineral resource, mineral reserve, project economics or development decision. Within those limits, the new assay package is strategically relevant because it expands the drill-assay dataset, strengthens the repeatability story, and provides more material for geological modelling, target ranking and representative metallurgical composite selection.
The strongest new intervals continue to show shallow rare earth mineralization with meaningful NdPr-led magnet rare earth content and Dy/Tb support. These elements are relevant to high-performance permanent magnets used in electric vehicles, wind turbines, robotics, advanced electronics and other energy-transition and industrial applications.
Next Milestones
Planned next workstreams include:
- Continued resource-definition drilling at Minas Americas;
- Continued integration of assay results into 3D geological modelling;
- Representative metallurgical composite selection and additional metallurgical testing;
- Publication of maiden S-K 1300 and NI 43-101 mineral resource estimates before the end of 2026, subject to drilling results, assay turnaround, technical work and regulatory review;
- Publication of a preliminary economic assessment in H1 2027, subject to completion of the required resource, metallurgical, engineering and economic work; and
- Continued strategic development and capital-markets preparation for Magnes, including the intended U.S. listing process if conditions and approvals support it.
Technical Notes
Assays are reported as head grades in parts per million (ppm). 10,000 ppm equals 1.0%. TREO means total rare earth oxides. MREO means the sum of Nd2O3, Pr6O11, Dy2O3 and Tb4O7. NdPr means the sum of Nd2O3 and Pr6O11. DyTb means the sum of Dy2O3 and Tb4O7. DREO, where referenced to prior leach testing, means desorbable rare earth oxides.
The selected composites in this release are length-weighted composites of contiguous assayed original drill interval samples. Summary calculations use head-grade assay values. Assay values reported by SGS as below detection limits were calculated at one-half of the stated detection limit; values reported as greater than a stated threshold were calculated at the stated threshold.
The assay statistics in this release are based on the 253 holes with assay intervals in the accompanying assay-results table. All holes reported in this release are shallow vertical drill holes. Reported intervals are drilled intervals; true thickness has not been determined.
QA/QC
Analyses were performed by SGS Geosol (Vespasiano, Brazil) using lithium-borate fusion with ICP-MS/OES methods for rare earth and oxide analysis. Magnes’ quality assurance and quality control program includes the regular insertion of blanks, certified reference materials, field duplicates and laboratory repeat/duplicate analyses into the sample stream. The Qualified Person reviewed the assay data, collar data and available QA/QC information relevant to the results disclosed in this news release and considers the data suitable for disclosure of exploration results.
Blanks, standards, field duplicates, lab repeats and other QA/QC/control samples are excluded from the assay result tables unless specifically discussed for QA/QC.
Qualified Person
The scientific and technical information contained in this news release has been reviewed and approved by Leonardo Deringer Fraga, P.Geo., an independent Qualified Person as defined by National Instrument 43-101 – Standards of Disclosure for Mineral Projects. Mr. Fraga is independent of Magnes Rare Earths and Verde AgriTech Ltd. His review included checking the underlying drillhole database, assay-results annexes and QA/QC information relevant to the results disclosed herein. EGBC Licence No. 61611.
About Magnes Rare Earths
Magnes Rare Earths was created as a wholly owned subsidiary of Verde AgriTech Ltd. to hold and advance the Minas Americas Global Alliance Project in Minas Gerais, Brazil. Magnes is intended to serve as Verde’s dedicated rare earths platform and, subject to market conditions and applicable approvals, pursue a future listing on a U.S. stock exchange.
About Verde AgriTech
Verde AgriTech is a Brazil-focused specialty fertilizer company listed on the TSX and OTCQX. The Company is advancing the Minas Americas Global Alliance rare earth project in Minas Gerais, Brazil, leveraging its operational platform and regional experience to accelerate exploration and technical de-risking.
For Additional Information
Investor Relations
Tel: +55 (31) 3245 0205; Email: investor@verde.ag
www.verde.ag | www.investor.verde.ag
Forward-Looking Statements
This news release contains forward-looking information and forward-looking statements within the meaning of applicable securities laws. Forward-looking statements include, but are not limited to, statements regarding the significance of exploration results, the interpretation of rare earth mineralization, the advancement of geological modelling, QA/QC review, metallurgical testwork, technical studies, future exploration activities, ongoing resource-definition drilling, the potential timing and publication of S-K 1300 and NI 43-101 mineral resource estimates, the potential timing and publication of a preliminary economic assessment, the potential pursuit of a U.S. stock exchange listing for Magnes, and Magnes’ and Verde’s plans, objectives, expectations or intentions.
Forward-looking statements are based on management’s current expectations, assumptions, estimates, projections and interpretations and involve known and unknown risks, uncertainties and other factors that may cause actual results or events to differ materially from those expressed or implied. These factors include, without limitation, risks related to exploration-stage projects, assay and metallurgical variability, geological interpretation, QA/QC procedures, mineral rights, permits, commodity markets, financing, regulatory approvals, exchange approvals, market conditions, and other risks described in applicable continuous disclosure filings.
No mineral resource estimate, mineral reserve estimate, production guidance, project economics, recovery estimate or development decision is being provided in this release. There is no certainty that further exploration will result in the delineation of mineral resources or mineral reserves, or that any development decision will be made. Readers are cautioned not to place undue reliance on forward-looking statements. Magnes and Verde do not undertake to update any forward-looking statement except as required by applicable securities laws.
Magnes Rare Earths to advance Minas Americas as a wholly owned subsidiary of Verde pending intended U.S. stock exchange listing; founder Cristiano Veloso to lead Magnes and continue supporting Verde through transition; Reberth Machado appointed Chief Executive Officer of Verde; Felipe Paolucci and Marcus Ribeiro will continue to serve as CFO and CRO respectively
THIS NEWS RELEASE IS NOT FOR DISSEMINATION IN THE UNITED STATES OR FOR DISTRIBUTION TO U.S. NEWSWIRE SERVICES
Belo Horizonte, Brazil, and Singapore, May 20, 2026 – Verde AgriTech Ltd (TSX: NPK | OTCQX: VNPKF) (“Verde” or the “Company”), is pleased to announce a strategic reorganization designed to sharpen focus, unlock value, and position both of its businesses for their next stage of growth.
The Board of Directors has approved the formation of Magnes Rare Earths (“Magnes”), a new wholly owned subsidiary of Verde that will hold and advance the Minas Americas Global Alliance Project in Minas Gerais, Brazil. As part of this transition, Cristiano Veloso will step down as Chief Executive Officer and as a director of Verde and assume the roles of Chief Executive Officer of Magnes Rare Earths. Reberth Machado has been appointed Chief Executive Officer of Verde, effective June 1st, 2026.
At Verde, Mr. Machado will work alongside Felipe Paolucci, who will continue as Chief Financial Officer, and Marcus Ribeiro, who will continue as Chief Revenue Officer. Together, the leadership team will focus on commercial execution, operational discipline, customer growth, and long-term profitable expansion.
Following the transition, Mr. Veloso will continue supporting Verde, on a non-exclusive external advisory basis, helping ensure leadership continuity and a successful separation of the two businesses. His support is expected to include transferring the institutional knowledge built over nearly two decades as founder and CEO, helping preserve continuity in selected long-standing stakeholder relationships where appropriate, and advising on separation-related matters between Verde and Magnes.
The Board believes this structure combines sharper strategic focus with continuity from Verde’s founder, while preserving Verde shareholders’ exposure to the potential value creation of both businesses as Magnes advances.
The Board determined that Verde’s fertilizer business and rare earths business have each reached a stage where dedicated leadership, tailored capital allocation and differentiated execution can create a clearer value proposition for shareholders. Recent public results at Minas Americas have continued to strengthen confidence in the Project’s scale and quality, while Verde has also publicly highlighted emerging channels with larger corporate customers in segments such as sugar cane and eucalyptus. The Board believes dedicated leadership on each platform is the best way to pursue both opportunities.
“Today’s announcement is about focus, continuity and value creation,” said Cristiano Veloso. “Verde now has two businesses with distinct opportunities, capital needs and execution priorities. Our fertilizer business has built a differentiated position in Brazil and now needs a Chief Executive Officer fully dedicated to commercial execution, customer expansion and profitability. At the same time, Minas Americas has advanced quickly enough that it now deserves a dedicated platform and leadership team to accelerate drilling, metallurgy, technical studies and capital-markets preparation. We believe this structure gives each business the attention it deserves while preserving shareholder exposure to both.”
“Reberth brings exactly the kind of leadership Verde needs for its next phase of growth,” Mr. Veloso added. “He is a chemical engineer with deep experience inside large-scale agro-industrial operations, including 12 years at Bioenergia do Brasil, where he served as CEO and led a major sugar-cane ethanol operation with responsibility for plant operations, farming and crop management. As Verde expands relationships with larger corporate customers, particularly in segments such as sugar cane and eucalyptus where a relatively small number of buyers can represent meaningful volume, that firsthand operating perspective is highly relevant. Verde remains deeply important to me. As founder, I am committed to helping ensure an orderly transition, transferring the institutional knowledge built over nearly two decades, and helping preserve continuity in long-standing relationships as Reberth, Felipe and Marcus lead Verde forward.”
Reberth Machado commented: “I am honored to join Verde at a moment when the Company has an opportunity to pair a differentiated fertilizer platform with a high-potential rare earths platform. Verde has built a compelling low-carbon specialty fertilizer business with strong technical differentiation and a clear opportunity to deepen penetration with larger, long-cycle customers. Having led a large agro-industrial operation, I understand how these customers evaluate productivity, reliability and return on investment. My priority is execution: strengthening strategically important accounts, deepening customer relationships, enhancing operating discipline and positioning Verde for long-term profitable growth. I look forward to working with Felipe and Marcus, and to benefiting from Cristiano’s knowledge and support during the transition.”
“Minas Americas has advanced rapidly, and recent results continue to strengthen our confidence in the scale and quality of the discovery,” Mr. Veloso added. “Magnes will provide a dedicated platform to accelerate technical de-risking, resource definition and strategic development at Minas Americas, while Verde shareholders continue to participate in that progress through Magnes’ ownership by Verde.”
The Company intends for Magnes to pursue a separate listing on a U.S. stock exchange, subject to market conditions, corporate approvals, applicable regulatory requirements, and any required shareholder approvals.
Verde believes this structure creates a clearer value proposition for shareholders: a dedicated, Brazil-focused specialty fertilizer business under focused operating leadership, alongside continued exposure to a fast-advancing rare earths platform. The Company also believes Magnes can advance Minas Americas from a strong starting point by leveraging Verde’s established operational platform and regional experience in Minas Gerais.
Corporate Reorganization Update Conference Call
The Company will host a conference call to discuss corporate reorganization and leadership transition. Subscribe using the link below and receive the conference details by email.
About Magnes Rare Earths
Magnes Rare Earths is created to advance the Minas Americas Global Alliance Project in Minas Gerais, Brazil. Magnes is intended to serve as Verde’s dedicated rare earths platform and, subject to market conditions and applicable approvals, to pursue a future listing on a U.S. stock exchange.
About Reberth Machado
Reberth Machado is a chemical engineer with 25 years of experience in project management, technology and business development, production and operations, and executive management. His international experience spans Canada, Germany, the United States and Brazil, and sectors including pharmaceuticals, energy, engineering and biofuels. Most recently, he served as Senior Manager, Corporate and Business Development at Steeper Energy, where he worked on commercialization opportunities in the renewable energy sector. Prior to that, Mr. Machado spent 12 years at Bioenergia do Brasil, including as Chief Executive Officer, where he led a major sugar-cane ethanol production facility in Brazil with responsibility for plant operations, farming and crop management. Earlier in his career, he served as Manager of Business Development and Technologies at Sherritt International in Canada and, before that, at ThyssenKrupp Uhde GmbH in Germany, where he was part of the executive team responsible for developing the company’s operations in the United States. He holds an MBA from the University of Alberta and an Advanced Management Degree from Harvard Business School.
About Verde Agritech
Verde AgriTech is a Brazil-focused specialty fertilizer company listed on the TSX and OTCQX. The Company is advancing the Minas Americas Global Alliance rare earth project in Minas Gerais, Brazil, leveraging its operational platform and regional experience to accelerate exploration and technical de-risking.
Forward-Looking Statements
This news release contains forward-looking information within the meaning of applicable Canadian securities laws, including statements regarding the Company’s intention to seek a listing of its securities on a U.S. securities exchange, the anticipated benefits of such listing, and the timing, approval and completion of such listing. Forward-looking information is based on management’s current expectations, estimates, assumptions and beliefs, including assumptions regarding market conditions, regulatory review, exchange approval, the Company’s satisfaction of applicable listing standards and the absence of material adverse changes. Forward-looking information is subject to risks and uncertainties that could cause actual results to differ materially, including risks that the Company may not satisfy applicable listing requirements, may not obtain required regulatory or exchange approvals, may determine not to proceed with the listing, or may experience delays due to market, regulatory or other factors.
This news release contains forward-looking information within the meaning of applicable securities laws, including statements regarding: the formation of Magnes; the leadership transition described herein; the board changes described herein; the intended role of Magnes in advancing Minas Americas; the expected provision of Mr. Veloso’s external advisory support to Verde; the potential benefits of the reorganization; and the intention to pursue a future U.S. stock exchange listing for Magnes. Forward-looking information is based on management’s current expectations, assumptions and estimates and is subject to known and unknown risks, uncertainties and other factors that may cause actual results to differ materially from those expressed or implied in such forward-looking information. These factors include, among others, the ability to complete the reorganization on the expected terms or timeline, the receipt of required approvals, market conditions, availability of financing, exploration and metallurgy results, technical study outcomes, and general economic, regulatory and business conditions. Readers are cautioned not to place undue reliance on forward-looking information. The Company undertakes no obligation to update forward-looking information except as required by applicable law.
For additional information please contact:
Investor Relations
Tel: +55 (31) 3245 0205; Email: investor@verde.ag
www.verde.ag | www.investor.verde.ag
Belo Horizonte, Brazil and Singapore, May 13, 2026 – Verde AgriTech Ltd (TSX: NPK | OTCQX: VNPKF) (“Verde” or the “Company”), today reported its financial results for the period ended March 31, 2026 (“Q1 2026”).
“Q1 2026 showed the value of discipline in a credit-constrained Brazilian agricultural market. Verde chose to prioritize liquidity, receivables quality and higher-quality counterparties over higher-risk volume. That approach reduced short-term sales, but it also supported a modest year-over-year improvement in EBITDA before non-cash events, a near-zero expected credit loss allowance and a stronger cash position following the brokered private placement completed in March 2026,” stated Cristiano Veloso, Founder and CEO of Verde.
“We are also taking decisive actions to align the cost base with current market conditions while preserving the capabilities required to serve customers and advance strategic priorities. These actions include supplier contract reviews, contract renegotiations, workforce reductions and tighter discretionary-spend controls. Subject to timing, completion and market conditions, we expect these initiatives to generate approximately BRL 9.4 million of annualized savings over the 12 months following implementation,” Mr. Veloso added.
First Quarter 2026 Financial Highlights
All figures are in Canadian dollars unless otherwise stated.
- Revenue in Q1 2026 was $1.7 million compared to $2.9 million in Q1 2025 and sales volume totaled 26,795 tons in Q1 2026 compared to 47,829 tons in Q1 2025. The decline reflected three linked drivers: tighter agricultural credit across Brazil, weaker near-term grower and distributor liquidity, and Verde’s more selective credit approvals in response to elevated sector insolvency risk. Management prioritized receivables quality and liquidity over higher-risk volume.
- Allowance for expected credit losses declined to $0.02 million in Q1 2026 from $0.5 million in Q1 2025.
- EBITDA before non-cash events improved modestly to $(1.36) million in Q1 2026 from $(1.43) million in Q1 2025, despite a 41% revenue decline, as lower expected credit losses and reduced sales and marketing expenses partly offset lower gross profit.
- Net loss narrowed to $(3.7) million in Q1 2026 from $(3.8) million in Q1 2025.
- As of March 31, 2026, the Company held $6.4 million in cash and $5.2 million in short-term receivables, compared to $2.5 million and $7.7 million, respectively, in the same period of 2025. The increase in cash position primarily reflects the brokered private placement completed in March 2026 for net proceeds of $4.0 million.
Q1 2026 Sustainability Results
In Q1 2026, product sold by Verde had the potential to capture up to 3,444 tons of CO₂ through Enhanced Rock Weathering, with an estimated net carbon removal of 2,372 tons, while also avoiding 1,354 tons of CO₂e emissions by replacing potassium chloride fertilizers. Since production began in 2018, the combined potential carbon removal and avoided emissions total approximately 342,517 tons of CO₂. Additionally, 2,121 tons of chloride were prevented from entering soils in Q1 2026, bringing the cumulative total avoided since inception to 194,434 tons.
Magnetic Rare Earth Program Highlights
During Q1 2026, Verde continued to advance the Minas Americas Global Alliance rare earth program through resource definition drilling, 3D geological modelling and metallurgical work. Results announced on March 17, 2026 provided additional technical support for the exploration model, including MAV_AD_0028, which returned 10.0 metres from surface averaging 8,439 ppm TREO and 1,965 ppm MREO, including 5.0 metres averaging 11,032 ppm TREO and 2,717 ppm MREO. The program remains at an exploration and technical de-risking stage and is focused on work required to support preparation of a maiden NI 43-101 mineral resource estimate, subject to further drilling, technical work and Qualified Person review. No mineral resource estimate, mineral reserve, production guidance or project economics is being provided in this release and there is no certainty that further exploration will result in the delineation of mineral resources or mineral reserves, or that any development decision will be made. Mineralization identified to date is not necessarily indicative of future results.
Leonardo Deringer Fraga, P.Geo, is the Company’s designated “Qualified Person” for this news release within the meaning of National Instrument 43-101 – Standards of Disclosure for Mineral Projects (“NI 43-101”). Mr. Fraga has reviewed and approved the technical information contained herein.
Strategic Initiatives And Recent Events
Liquidity Preservation and Creditor Engagement Strategy
As previously announced by the Company on April 15, 2025, the civil court homologated Verde’s Debt Renegotiation Agreement, which provided for revised payment terms applicable to the Company’s financial creditors. Following a review of the Company’s liquidity position, working capital requirements, cash flow forecasts, debt-service obligations and available alternatives, the Board of Directors approved a liquidity preservation and creditor engagement strategy.
As part of this Board-approved strategy, the Company will suspend scheduled debt-service payments to its financial creditors under the Debt Renegotiation Agreement homologated by the Brazilian civil court and related financing agreements, as such payments become due going forward, while the Company engages with creditors regarding revised payment terms that are sustainable under current market conditions. The Company intends to seek waivers, standstill arrangements, amendments, extensions or other revised terms with such creditors.
The decision reflects the continued restrictive operating environment for Brazilian agriculture, limited credit availability, elevated interest rates, pressure on grower liquidity and the need to preserve working capital for the Company’s operations. The suspension of scheduled debt-service payments may result in creditor notices, claims or proceedings under applicable financing and debt renegotiation arrangements. The Company has retained specialized legal and restructuring advisors in Brazil to support the creditor engagement process, represent the Company where necessary and assist management and the Board in implementing the strategy in an orderly manner.
Fertilizer Market Conditions
Q1 2026 was shaped less by agronomic need than by credit transmission. The Selic rate remained at 15.00% for most of the quarter, was reduced to 14.75% on March 18, 2026, and was further reduced to 14.50% after quarter-end on April 29, 2026, while the Central Bank of Brazil Focus survey dated April 24, 2026 showed the market’s year-end 2026 Selic expectation at 13.00%, up from 12.50% four weeks earlier[1]. Financing conditions therefore remained restrictive for growers, distributors and cooperatives. Serasa Experian reported 1,990 agribusiness judicial recovery requests in 2025, up 56.4% from 2024, the highest level in its series[2].
The agronomic backdrop remained constructive. On April 14, 2026, Companhia Nacional de Abastecimento raised its 2025/26 Brazilian grain harvest estimate to 356.3 million tons, including projected record soybean production of 179.2 million tons and total corn production of 139.6 million tons[3]. However, strong production potential did not immediately translate into stronger fertilizer purchasing capacity, as farmers continued to manage liquidity after a period of high interest rates, tight rural credit and compressed crop economics.
Input affordability worsened after quarter-end as global fertilizer markets tightened. World Bank commodity data showed fertilizer prices rising 14% in April[4] and projected a 31% increase in 2026[5], while Reuters reported warnings of potential fertilizer supply disruptions linked to the Middle East conflict[6]. In Brazil, StoneX data showed local urea prices rising about 35% in two weeks, with buyers increasingly considering lower-cost alternatives[7]. For Verde, this volatility reinforces the strategic relevance of domestic potassium alternatives, but the principal near-term constraint remains financing capacity and counterparty quality rather than agronomic demand.
Management therefore continued to prioritize counterparty selection, receivables protection and liquidity preservation over short-term volume, while aligning commercial efforts toward higher-quality accounts and higher-margin regions. This approach may cap near-term volumes, but it is intended to protect cash conversion, reduce credit risk and preserve Verde’s ability to capture demand if credit conditions and grower purchasing capacity improve.
Q1 2026 FINANCIAL RESULTS
The following table provides information about the three months ended March 31, 2026, as compared to the three months ended March 31, 2025.
| All amounts in CAD $’000 |
3 months ended
Mar 31, 2026 |
3 months ended
Mar 31, 2025 |
| Tons sold (‘000) |
27 |
48 |
| Average revenue per ton sold $ |
62 |
59 |
| Average production cost per ton sold $ |
(23) |
(16) |
| Average gross profit per ton sold $ |
39 |
44 |
| Average gross margin |
63% |
73% |
| |
|
|
| Revenue |
1,677 |
2,852 |
| Production costs |
(628) |
(757) |
| Gross Profit |
1,049 |
2,095 |
| Gross Margin |
63% |
73% |
| Sales and marketing expenses |
(727) |
(851) |
| Product delivery freight expenses |
(625) |
(1,115) |
| General and administrative expenses |
(1,033) |
(1,050) |
| Allowance for expected credit losses |
(24) |
(513) |
| EBITDA (1) |
(1,360) |
(1,434) |
| Share Based, Equity and Bonus Payments (Non-Cash Event) (2) |
(68) |
(161) |
| Depreciation and Amortization (3) |
(836) |
(774) |
| Operating (Loss) / Profit after non-cash events |
(2,264) |
(2,369) |
| Interest Income/Expense |
(1,464) |
(1,408) |
| Net (Loss) / Profit before tax |
(3,728) |
(3,777) |
| Income tax |
(1) |
(4) |
| Net (Loss) / Profit |
(3,729) |
(3,781) |
(1) Non-GAAP measure. EBITDA before non-cash events is calculated as operating loss before depreciation, amortization and non-cash events. Refer to the section entitled “Non-GAAP and Other Financial Measures” below.
(2) Included within General and Administrative expenses in the financial statements.
(3) Included within General and Administrative expenses and Cost of Sales in the financial statements.
Sales Performance
Revenue for Q1 2026 was $1.7 million compared to $2.9 million in Q1 2025. The decline was primarily driven by lower volumes in a market where customers faced tighter credit, weaker near-term cash generation and more selective purchasing behavior. Verde maintained a rigorous credit approval process, particularly for specialty fertilizer sales that include third-party raw materials and chose not to extend higher-risk terms that were not adequately compensated.
Production costs[8]
Average production cost per ton sold increased to $23 in Q1 2026 from $16 in Q1 2025, primarily due to lower sales volumes, which reduced fixed-cost absorption, and a less favorable product and packaging mix. Specialty products represented 8% of sales in Q1 2026 compared to 3% in Q1 2025, while big bag products represented 12% of sales versus 9% in the prior-year period. As a result, average gross profit per ton declined to $39 from $44, contributing to the reduction in gross margin to 63% in Q1 2026 from 73% in Q1 2025.
General and administrative expenses
General administrative expenses include general office expenses, rent, bank fees, insurance, foreign exchange variances and remuneration of executives, directors of the Board and administrative staff. Total general and administrative expenses decreased by 2% compared to the same period last year, due to a series of contract renegotiations with suppliers and a reduction in administrative headcount. Management is also reviewing supplier contracts, workforce structure and discretionary spending, and, subject to timing, completion and market conditions, expects related initiatives to generate approximately BRL 9.4 million of annualized savings over the 12 months following implementation.
Allowance for expected credit losses
The allowance for expected credit losses decreased from $0.5 million in Q1 2025 to $0.02 million in Q1 2026, primarily reflecting lower delinquency levels following the implementation of stricter credit policies.
Financial Results and Profitability
EBITDA before non-cash events for Q1 2026 improved modestly to $(1.36) million from $(1.43) million in Q1 2025, as materially lower expected credit losses and reduced sales, marketing and freight expenses partly offset lower gross profit from reduced volumes. Refer to the section entitled “Non-GAAP and Other Financial Measures” below.
Net loss for Q1 2026 was $(3.7) million, compared to a net loss of $(3.8) million in Q1 2025. Results continued to reflect elevated net finance expense in a high-interest rate environment, with net finance expense totaling $(1.5) million in the quarter compared to $(1.4) million in Q1 2025.
Basic loss per share totaled $(0.066) in Q1 2026, compared to $(0.072) in Q1 2025.
Liquidity, Debt and Working Capital
As of March 31, 2026, the Company held $6.4 million in cash and $5.2 million in short-term receivables. The higher cash balance primarily reflects completion of the brokered private placement in March 2026, which generated net proceeds of $4.0 million. Total loan balance was $52.2 million, of which $6.2 million was due within 12 months and $46.0 million was due thereafter, with an average interest rate of 16.75% per annum.
The Company ended Q1 2026 with positive working capital of $4.3 million. Current liabilities increased to $8.9 million from $2.9 million at March 31, 2025, primarily reflecting the scheduled reclassification of borrowings into the current portion as repayments come due following the renegotiated debt profile, rather than a deterioration in underlying liquidity.
Net cash used in operating activities narrowed to $(0.5) million in Q1 2026, compared to $(0.9) million in Q1 2025, primarily reflecting tighter credit underwriting and working capital management, which helped stabilize cash flow despite weaker sales.
Q1 2026 Financial Results Conference Call
The Company will host a conference call to discuss Q1 2026 results and provide an update on its magnetic rare earth program. Subscribe using the link below and receive the conference details by email.
The Company’s financial statements and related notes for the period ended March 31, 2026 are available to the public on SEDAR+ at www.sedarplus.ca and the Company’s website at www.investor.verde.ag/.
About Verde AgriTech
Verde AgriTech is a Brazil‑focused specialty fertilizer company listed on the TSX and OTCQX. The Company is advancing the Minas Americas Global Alliance rare earth project in Minas Gerais, Brazil, leveraging its operational platform and regional experience to accelerate exploration and technical de‑risking. For more information on how we are leading the way towards sustainable agriculture and climate change mitigation in Brazil, visit our website at https://verde.ag/en/home/.
For additional information please contact:
Cristiano Veloso, Chief Executive Officer and Founder
Tel: +55 (31) 3245 0205; Email: investor@verde.ag
www.verde.ag | www.investor.verde.ag
Non-GAAP and Other Financial Measures
Earnings before interest, taxes, depreciation and amortization (“EBITDA”) is not a generally accepted measure of financial performance under IFRS. Management of the Company utilizes EBITDA as a financial performance measure to assess profitability and return on equity in its decision-making. In addition, the Company, its lenders and investors use EBITDA to measure performance and value for various purposes. Investors are cautioned, however, that EBITDA should not be construed as an alternative to net loss attributable to common shareholders determined in accordance with IFRS as an indicator of the Company’s performance.
The Company’s method of calculating EBITDA may differ from other companies and, accordingly, they may not be comparable to similarly named measures used by other companies. A quantitative reconciliation of EBITDA is included below.
| Adjusted EBITDA Reconciliation |
3 months ended
Mar 31, 2026 |
3 months ended
Mar 31, 2025 |
| Net loss |
(3,729) |
(3,781) |
| Add (Deduct): |
|
|
| Interest Income/Expense |
1,464 |
1,408 |
| Income tax |
1 |
4 |
| Share-Based, Equity and Bonus Payments (Non-Cash Event) |
68 |
161 |
| Depreciation and Amortization |
836 |
774 |
| Adjusted EBITDA (1) |
(1,360) |
(1,434) |
(1) Refer to “Non-GAAP and Other Financial Measures” section of MD&A for discussion of non-IFRS measures used in this table.
Cautionary Language Regarding Forward-Looking Statements and Other Advisories
Forward-Looking Information and Forward-Looking Statements
This news release contains “forward-looking information” within the meaning of applicable Canadian securities laws and “forward-looking statements” within the meaning of the United States Private Securities Litigation Reform Act of 1995 (collectively, “forward-looking statements”). Forward-looking statements are made as of the date of this news release and relate to future events or performance. Often, but not always, forward-looking statements can be identified by words such as “expects,” “anticipates,” “plans,” “projects,” “estimates,” “envisages,” “assumes,” “intends,” “strategy,” “goals,” “objectives,” or variations (including negative variations) of such words and phrases, or statements that certain actions, events or results “may,” “could,” “would,” “might,” or “will” be taken, occur or be achieved.
Forward-looking statements in this news release include, without limitation, statements with respect to: (i) the potential amount of CO₂ removal per ton of rock during the financial period; (ii) the possibility of a future maiden NI 43-101 technical report in respect of the Minas Americas Global Alliance rare earth program and the potential timing of same; (iii) sales assumptions and the expected effects of restructuring initiatives; (iv) the Company’s competitive position in Brazil and potash market demand; (v) the terms, timing, court approval and financial impact of any debt restructuring; ; and (vi) expected annualized cost savings, implementation of expense controls, the liquidity preservation and creditor engagement strategy approved by the Board of Directors, including the suspension of scheduled debt-service payments under the Debt Renegotiation Agreement homologated by the civil court in Brazil and related financing agreements, and the Company’s efforts to obtain waivers, standstill arrangements, amendments, extensions or other revised terms.
These forward-looking statements are based on the Company’s and its consultants’ reasonable assumptions, estimates and opinions as of the date hereof, including, without limitation: (i) the presence and continuity of mineralization at estimated grades; (ii) geotechnical, hydrological and metallurgical characteristics of rock consistent with sampled results; (iii) foreign exchange rates; (iv) realized sales prices, market size and adoption for the Company’s products; (v) applicable discount, tax and royalty rates; (vi) availability and cost of acceptable financing; (vii) reasonable contingency allowances; (viii) successful execution of operating plans; and (ix) the Company’s ability to negotiate with creditors in connection with its efforts to restructure its Debt Renegotiation Agreement.
Forward-looking statements are inherently subject to known and unknown risks, uncertainties and other factors that may cause actual results to differ materially from those expressed or implied. Such risks and uncertainties include, without limitation: risks related to court approvals and the completion of any debt restructuring; variations in grade or recovery; adverse geotechnical, hydrological or metallurgical conditions; changes in project parameters as plans continue to be refined; cost escalation and inflationary pressures; labour availability; fluctuations in commodity prices and demand (including potash); foreign-exchange volatility (including Brazilian Real–Canadian dollar); availability and terms of financing; changes in agricultural credit conditions, customer insolvencies and collection risk; the Company’s ability to implement restructuring measures and realize expected cost savings; changes in tax and royalty regimes; delays in permitting or stakeholder agreements; competitive pressures; infrastructure and operational risks; regulatory changes affecting mining, fertilizers and carbon-removal markets; and, for carbon-removal activities, risks relating to methodology eligibility, additionality, durability/permanence, leakage, monitoring, verification, certification, policy shifts and pricing, any of which could affect the issuance, saleability or value of credits. Additional information about risk factors is described in the Company’s most recent Annual Information Form filed on SEDAR+ (www.sedarplus.ca) and in other continuous disclosure filings. The foregoing list is not exhaustive, and there can be no assurance that forward-looking statements will prove accurate. Additional risks include potential creditor notices, claims or proceedings under applicable financing and debt renegotiation arrangements, the outcome of creditor discussions and the Company’s ability to manage the process with the support of specialized legal and restructuring advisors.
Readers are cautioned not to place undue reliance on forward-looking statements. Except as required by applicable law, the Company disclaims any intention or obligation to update or revise any forward-looking statements, whether as a result of new information, future events or otherwise.
Financial Outlook / Future-Oriented Financial Information
This news release may contain future-oriented financial information or financial outlooks (collectively, “FOFI”) within the meaning of applicable securities laws, including, without limitation, management’s expectations regarding near-term sales volumes, expected annualized cost savings, the effects of restructuring initiatives, liquidity preservation and, where applicable, estimates of capital and operating costs, net present value, internal rate of return, payback and projected revenues or cash flows. Such FOFI is provided to describe management’s current expectations regarding the Company’s business, market conditions and proposed project development and may not be appropriate for other purposes. The FOFI is based on the assumptions and subject to the risks described above, and actual results may vary materially.
Currency, Units and Trademarks
Unless otherwise stated, all figures are in Canadian dollars (C$). Tonnages are metric tons.
Third Party Sources
This news release contains information concerning the Company’s industry and the markets in which it operates, which is based on information from independent third-party sources. Although management of the Company believes these sources to be generally reliable, market and industry data is inherently imprecise, subject to interpretation and cannot be verified with complete certainty due to limits on the availability and reliability of raw data, the voluntary nature of the data gathering process, and other limitations and uncertainties inherent in any statistical survey or data collection process. Management of the Company has not independently verified any third-party information contained herein.
Consolidated Statement Of Profit or Loss[9]
For the quarter ended 31 March 2026
All amounts expressed in Canadian Dollars.
| |
3 Months ended
31 Mar 2026
$’000
|
3 Months ended
31 Mar 2025
$’000
|
| Revenue |
1,677 |
2,852 |
| Cost of sales |
(1,425) |
(1,492) |
| Gross Profit |
252 |
1,360 |
| |
|
|
| Sales and distribution expenses |
(1,352) |
(1,966) |
| Administrative expenses |
(1,164) |
(1,763) |
| Operating (Loss) / Profit |
(2,264) |
(2,369) |
| |
|
|
| Finance costs |
(1,543) |
(1,481) |
| Finance income |
79 |
73 |
| Loss before tax from continuing operations |
(3,728) |
(3,777) |
| |
|
|
| Income tax expense |
(1) |
(4) |
| Loss for the quarter |
(3,729) |
(3,781) |
| Loss per share ($) |
3 Months ended
31 Mar 2026
|
3 Months ended
31 Mar 2025
|
| Basic and dilutive loss per share |
(0.066) |
(0.072) |
Consolidated statement of financial position[10]
As at 31 March 2026
All amounts expressed in Canadian Dollars.
|
Assets |
31 March 2026 |
31 Dec 2025 |
| |
|
| ($’000) |
($’000) |
| Property, plant and equipment |
41,572 |
39,445 |
| Mineral properties |
19,267 |
18,374 |
| Other assets |
424 |
396 |
| Deferred tax asset |
2,777 |
2,595 |
| Total non-current assets |
64,040 |
60,810 |
| Inventory |
1,561 |
1,376 |
| Trade and other receivables |
5,176 |
5,311 |
| Cash and cash equivalents |
6,385 |
2,985 |
| Total current assets |
13,122 |
9,672 |
| Total assets |
77,162 |
70,482 |
| |
|
|
|
| Issued capital |
21,342 |
20,664 |
| Capital contribution |
49,862 |
49,862 |
| Warrants reserve |
3,374 |
– |
| Merger reserve |
(4,557) |
(4,557) |
| Translation reserve |
(13,960) |
(14,924) |
| Accumulated losses |
(33,923) |
(30,262) |
| Total equity |
22,138 |
20,783 |
| Liabilities |
|
|
|
|
| Interest-bearing loans and borrowings |
46,037 |
41,997 |
| Provisions |
137 |
128 |
| Total non-current liabilities |
46,174 |
42,125 |
| Trade and other payables |
2,663 |
2,148 |
| Interest-bearing loans and borrowings |
6,181 |
5,421 |
| Other financial liabilities |
6 |
5 |
| Total current liabilities |
8,850 |
7,574 |
| Total liabilities |
55,024 |
49,699 |
| Total equity and liabilities |
77,162 |
70,482 |
|
|
|
|
|
|
|
|
[1] Source: Banco Central do Brasil – Copom Minutes and Selic Rate Decisions.
[2] Source: Serasa Experian – Judicial Reorganization: Agribusiness closes 2025 with almost 2,000 requests for this recourse and registers the highest accumulated total in the historical series, reveals Serasa Experian.
[3] Source: Companhia Nacional de Abastecimento – Grain harvest could reach 356.3 million tons in 2025/26, influenced by good yields.
[4] Source: World Bank – Commodity prices rose in April – Pink Sheet (May 5, 2026);
[5] Source: World Bank – Commodity Markets Outlook, April 2026.
[6] Source: Reuters – Expanding Iran conflict threatens Brazil grain exports, fertilizer supplies (March 5, 2026).
[7] Source: Reuters – Brazil sounds alarm on fertilizers as price spike spurs cheaper alternatives (March 18, 2026);
[8] Verde’s production costs and sales price are based on the following assumptions:
- Micronutrients added to the product increase production cost, rendering the applicable product more expensive to produce.
- Production costs vary based on packaging type, with bulk being less expensive than Jumbo Bags.
- Plant 1 produces The Product® Jumbo Bags and Low-Carbon Specialty Fertilizer Products, while Plant 2 exclusively produces The Product® Bulk. Therefore, Plant 2’s production costs are lower than Plant 1’s costs.
[9] For important notes and disclosures, please refer to the Company’s Q1 2026 full consolidated financial statements and accompanying notes.
[10] For important notes and disclosures, please refer to the Company’s Q1 2026 full consolidated financial statements and accompanying notes.
All figures are in Canadian dollars unless otherwise stated.
Belo Horizonte, Brazil and Singapore, March 26, 2026 – Verde AgriTech Ltd (TSX: NPK | OTCQX: VNPKF) (“Verde” or the “Company”), today reported its operating and financial results for the fourth quarter and fiscal year ended December 31, 2025 (“Q4 2025” and “FY 2025”).
“The Great Brazilian Agriculture Crisis continued to weigh on sales throughout 2025, and the sharp rise in judicial recovery filings across Brazil’s agribusiness sector shows how stressed the market remains. Since the crisis began in 2023, Verde has maintained a highly restrictive credit approval policy, prioritizing receivables quality, liquidity preservation and commercial discipline over volume at any cost. We believe this has been the right approach to protect the Company and preserve its ability to grow when sector credit conditions begin to normalize” stated Cristiano Veloso, Founder and CEO of Verde AgriTech.
Fourth Quarter And Full Year 2025 Financial Highlights
FY 2025 was a year of disciplined credit-risk management in a highly stressed Brazilian agricultural input market. Q4 2025 provided early evidence of improved commercial quality, with higher revenue per ton and materially lower expected credit losses.
- Revenue in FY 2025 was $16.6 million compared to $21.6 million in FY 2024. In Q4 2025 revenue increased to $3.1 million from $2.9 million in Q4 2024.
- Sales Volume totaled 258,432 tons in FY 2025 compared to 318,870 tons in FY 2024 and 45,113 tons in Q4 2025 versus 47,888 tons in Q4 2024 as deteriorating credit conditions across Brazilian agriculture and the Company’s tighter credit approvals reduced higher-risk sales, with Verde prioritizing receivables quality and liquidity over volume.
- Gross margin remained resilient at 72% in FY 2025 compared to 71% in FY 2024. In Q4 2025 Gross Margin was 63% compared to 65% in Q4 2024.
- Allowance for expected credit losses declined to $0.9 million in FY 2025 from $2.3 million in FY 2024. In Q4 2025, allowance for expected credit losses declined to $0.3 million from $1.3 million in Q4 2024.
- EBITDA before non-cash events remained stable year over year at $(2.8) million despite lower FY 2025 revenue. In Q4 2025, EBITDA improved to $(1.3) million from $(2.1) million in Q4 2024.
- Net loss narrowed to $(11.7) million in FY 2025 from $(12.6) million in FY 2024. In Q4 2025, net loss was $(3.4) million compared to $(2.8) million in Q4 2024.
- As of December 31, 2025, the Company held $3.0 million in cash and $5.3 million in short-term receivables. Subsequent to year-end, the Company completed a brokered private placement for gross proceeds of $4.5 million[1].
Q4 2025 and FY 2025 Sustainability Results
In Q4 2025, product sold by Verde had the potential to capture up to 5,414 tons of CO₂ through Enhanced Rock Weathering, with an estimated net carbon removal of 3,940 tons, while also avoiding 2,373 tons of CO₂e emissions by replacing potassium chloride fertilizers. Since production began in 2018, the combined potential carbon removal and avoided emissions total approximately 337,719 tons of CO₂. Additionally, 3,571 tons of chloride were prevented from entering soils in Q4 2025, bringing the cumulative total avoided since inception to 192,313 tons.
Magnetic Rare Earth Program Highlights
Since first disclosing its district-scale clay-hosted rare earth discovery in Minas Gerais, Brazil in October 2025, and formally naming it the Minas Americas Global Alliance Project later that month, Verde has advanced a growing drill-confirmed clay-hosted rare earth discovery, with the footprint now exceeding 3.5 km² within a mapped and surface-sampled geological unit exceeding 15 km² and drilling ongoing across eight additional targets. Metallurgical work has confirmed ionic-adsorption behaviour, with leach tests returning up to 667 mg/kg of DREO and 278 mg/kg of MREO in primary leach solution, while thorium and uranium were at or below detection in the best intervals. Drilling has consistently intersected shallow mineralization from surface, including 14.2 metres averaging 6,858 ppm TREO and 1,673 ppm MREO, 13.0 metres averaging 0.83% TREO including 8.0 metres at 1.01% TREO, and, most recently, 10.0 metres averaging 8,439 ppm TREO and 1,965 ppm MREO, including 5.0 metres averaging 11,032 ppm TREO and 2,717 ppm MREO. These results are supporting 3D modelling, representative metallurgical composites and continued advancement toward a maiden resource.
Strategic Initiatives And Recent Events
Brokered LIFE Financing[2]
Subsequent to year-end, the Company completed a brokered private placement for gross proceeds of $4.5 million (approximately $4.0 million net after commissions, transaction fees and offering-related costs). The Company intends to use the net proceeds raised from the Offering to accelerate work at its Minas Americas Global Alliance rare earth project, including resource definition drilling, metallurgy optimization, and other technical de-risking required for maiden NI 43-101 and for working capital and general corporate purposes.
Fertilizer Market Conditions and 2026 Outlook
Brazil’s agricultural input market remained under significant financial pressure throughout 2025. On March 18, 2026, Central Bank of Brazil reduced the Selic rate to 14.75% from 15.00[3]%, but financing conditions remain highly restrictive for growers and agricultural distributors. Serasa Experian reported 1,990 agribusiness judicial recovery requests in 2025, up 56.4% from 2024, underscoring the degree of financial stress across the sector[4]. In this environment, credit availability became the principal commercial constraint, as purchasing decisions were driven by liquidity preservation, restricted financing and lower willingness to assume credit risk across the distribution chain.
Farm economics were also pressured by an unfavorable spread between costs and crop prices. The World Bank reported that fertilizer prices increased nearly every month during 2025, while food commodity prices were 5% lower than a year earlier[5]. This divergence compressed profitability across several crops and reduced producers’ capacity to commit cash to input purchases. In soybeans, one of Brazil’s key farm-economics benchmarks, recent analysis indicates that margins are approaching breakeven as lower soybean prices, elevated production costs and weak port premiums continue to pressure returns[6].
The agronomic backdrop itself remains constructive, with the Companhia Nacional de Abastecimento (Conab) projecting a record Brazilian grain harvest in 2025/26. However, stronger production does not immediately repair producer balance sheets after two years of tighter credit, higher financing costs and weaker cash generation. Conab has also indicated that soybean trading entered 2026 at a slow pace and under defensive demand conditions[7], reinforcing the view that many growers may continue to shorten purchasing windows and delay commercial decisions despite solid crop fundamentals. Taken together, these indicators suggest that the near-term constraint is credit availability and growers’ ability to finance purchases, rather than agronomic demand.
Looking ahead, Verde believes market conditions are likely to remain challenging in the near term, with tighter agricultural credit continuing to constrain fertilizer sales. According to Agrinvest Commodities Consultoria, fertilizer purchases for the 2026/27 season in the Company’s key markets are running at roughly half the historical pace for this point in the season. Against this backdrop, the Company expects Q1 2026 sales volumes to remain below the prior year. In response, Verde is implementing strategic adjustments across the business, including workforce reductions, contract reviews and other cost-efficiency initiatives, which are expected to generate over BRL 6 million in savings over 12 months. Together with a sharper commercial focus on higher-margin regions and assuming the current fertilizer price environment is sustained, these actions are expected to support positive EBITDA in 2026, even at sales volumes broadly in line with 2025.
[1] Learn More at: Verde AgriTech Announces Closing of $4.5 Million LIFE Financing With Majority Subscribed by Leading Resources Institutional Investor.
[2] Learn More at: Verde AgriTech Announces Closing of $4.5 Million LIFE Financing With Majority Subscribed by Leading Resources Institutional Investor.
[3] Source: Banco Central do Brasil – Copom Minutes and Selic Rate Decisions.
[4] Source: Serasa Experian. Judicial Reorganization: Agribusiness closes 2025 with almost 2,000 requests for this recourse and registers the highest accumulated total in the historical series, reveals Serasa Experian (March 9, 2026).
[5] Source: World Bank. Food Security Update 119.
[6] Source: Conab. Logistics Bouletin (February 26, 2026).
[7] Source: Conab. Grain-harvest survey release (March 13, 2026).
Q4 2025 AND FY 2025 FINANCIAL RESULTS
The following table provides information about the three and twelve months ended December 31, 2025, as compared to the three and twelve months ended December 31, 2024.
| All amounts in CAD $’000 (except per ton) |
3 months ended
Dec 31, 2025 |
3 months ended
Dec 31, 2024 |
12 months ended
Dec 31, 2025 |
12 months ended
Dec 31, 2024 |
| Tons sold (‘000) |
45 |
48 |
258 |
319 |
| Average revenue per ton sold $ |
68 |
60 |
64 |
68 |
| Average Production cost per ton sold $ |
(25) |
(21) |
(18) |
(20) |
| Average Gross Profit per ton sold $ |
43 |
39 |
46 |
48 |
| Gross Margin |
63% |
65% |
72% |
71% |
| |
|
|
|
|
| Revenue |
3,080 |
2,888 |
16,605 |
21,597 |
| Production Costs |
(1,123) |
(986) |
(4,643) |
(6,302) |
| Gross Profit |
1,957 |
1,902 |
11,962 |
15,295 |
| Gross Margin |
63% |
65% |
72% |
71% |
| Sales and marketing expenses |
(813) |
(842) |
(3,462) |
(3,686) |
| Product delivery freight expenses |
(1,031) |
(938) |
(6,180) |
(7,705) |
| General and administrative expenses |
(1,186) |
(957) |
(4,239) |
(4,424) |
| Allowance for expected credit losses |
(259) |
(1,302) |
(929) |
(2,320) |
| EBITDA (1) |
(1,332) |
(2,137) |
(2,848) |
(2,840) |
| Non-Cash Events (2) |
(502) |
325 |
(727) |
(1,821) |
| Depreciation, amortization and gain/(loss) on disposal of plant and equipment (3) |
(873) |
(753) |
(3,217) |
(3,232) |
| Operating (Loss) / Profit after non-cash events |
(2,707) |
(2,565) |
(6,792) |
(7,893) |
| Net finance expense |
(667) |
(262) |
(4,858) |
(4,634) |
| Net (Loss) / Profit before tax |
(3,374) |
(2,827) |
(11,650) |
(12,527) |
| Income tax |
(3) |
(4) |
(20) |
(31) |
| Net (Loss) / Profit |
(3,377) |
(2,831) |
(11,670) |
(12,558) |
(1) Non-GAAP measure. EBITDA before non-cash events is calculated as operating loss before depreciation, amortization and non-cash events.
(2) Included within General and Administrative expenses in the financial statements. For FY 2025, this amount includes the accounting recognition associated with the transfer of mineral rights to Oby Rare Earths and expenses related to stock options granted during the period. Comparative period amounts relate to non-cash items recognized in the respective periods.
(3) Included within General and Administrative expenses and Cost of Sales in the financial statements.
Sales Performance
Revenue for FY 2025 was $16.6 million compared to $21.6 million in FY 2024. The decline was primarily driven by lower volumes in a market where growers faced tighter credit conditions and weaker near-term cash generation. Verde maintained a rigorous credit approval process, particularly for specialty fertilizer sales that include third-party raw materials and chose to limit higher-risk exposure rather than extend terms that were not adequately compensated.
General and administrative expenses
Expenses decreased to $4.2 million in FY 2025 from $4.4 million in FY 2024, primarily reflecting lower legal, professional and consulting expenses over the course of the year. In Q4 2025, G&A increased to $1.2 million from $1.0 million in Q4 2024, mainly due to the recognition of a provision for success-based legal fees associated with the Company’s debt renegotiation and restructuring efforts.
Allowance for expected credit losses
The allowance for expected credit losses decreased from $2.3 million in 2024 to $0.9 million in 2025, primarily reflecting lower delinquency levels following the implementation of stricter credit policies.
Financial Results and Profitability
EBITDA before non-cash events for FY 2025 was $(2.8) million compared to $(2.8) million in FY 2024.
Net loss for FY 2025 was $(11.7) million, compared to a net loss of $(12.6) million in FY 2024. Results continued to reflect elevated net finance expense in a high-interest rate environment.
Basic loss per share totaled $(0.22) in FY 2025, compared to $(0.24) in FY 2024.
Liquidity, Debt and Working Capital
As of December 31, 2025, the Company held $3.0 million in cash and $5.3 million in short-term receivables. Total loan balance was $47.4 million, of which $5.4 million was due within 12 months and $42.0 million was due thereafter, with an average interest rate of 17% per annum.
The Company ended FY 2025 with positive working capital of $2.1 million. The year-over-year increase in current liabilities primarily reflects the scheduled reclassification of borrowings into the current portion as repayments come due following the renegotiated debt profile, rather than a deterioration in underlying liquidity.
Net cash used in operating activities narrowed materially to $(0.03) million in FY 2025, compared to $(1.9) million in FY 2024, primarily reflecting tighter credit underwriting and working capital management, which helped stabilize cash flow despite weaker sales.
Q4 & FY 2025 Financial Results Conference Call
The Company will host a conference call to discuss Q4 & FY 2025 results and provide an update on its magnetic rare earth program. Subscribe using the link below and receive the conference details by email.
The Company’s financial statements and related notes for the year ended December 31, 2025 are available to the public on SEDAR+ at www.sedarplus.ca and the Company’s website at www.investor.verde.ag/.
About Verde AgriTech
Verde AgriTech is a Brazil‑focused specialty fertilizer company listed on the TSX and OTCQX. The Company is advancing the Minas Americas Global Alliance rare earth project in Minas Gerais, Brazil, leveraging its operational platform and regional experience to accelerate exploration and technical de‑risking. For more information on how we are leading the way towards sustainable agriculture and climate change mitigation in Brazil, visit our website at https://verde.ag/en/home/.
For additional information please contact:
Cristiano Veloso, Chief Executive Officer and Founder
Tel: +55 (31) 3245 0205; Email: investor@verde.ag
www.verde.ag | www.investor.verde.ag
Cautionary Language and Forward-Looking Statements
Cautionary Note Regarding Mineral Resources and Reserves (NI 43-101 / CIM)
Unless otherwise indicated, all scientific and technical information in this news release has been prepared in accordance with National Instrument 43-101 – Standards of Disclosure for Mineral Projects (“NI 43-101”) and the Canadian Institute of Mining, Metallurgy and Petroleum (“CIM”) Definition Standards (May 10, 2014). Mineral Resources that are not Mineral Reserves do not have demonstrated economic viability. Inferred Mineral Resources are considered too speculative geologically to have economic considerations applied to them that would enable them to be categorized as Mineral Reserves, and there is no certainty that any part of an Inferred Mineral Resource will be converted into Measured or Indicated Mineral Resources or into Mineral Reserves. The results of any preliminary economic assessment (“PEA”) or pre-feasibility study (“PFS”), to the extent referenced, are preliminary in nature and include inferred Mineral Resources that are considered too speculative geologically to have economic considerations applied to them that would enable them to be categorized as Mineral Reserves; there is no certainty that the PEA or PFS results will be realized.
Cautionary Note to U.S. Investors
The terms “Mineral Resource,” “Inferred Mineral Resource,” “Indicated Mineral Resource,” and “Measured Mineral Resource,” and “Mineral Reserve,” as used herein, are defined in accordance with NI 43-101 and the CIM Definition Standards, which differ in certain respects from the requirements of the U.S. Securities and Exchange Commission (“SEC”), including Subpart 1300 of Regulation S-K (“S-K 1300”). Accordingly, information contained herein may not be comparable to similar information made public by U.S. companies subject to the SEC’s reporting and disclosure requirements.
Forward-Looking Information and Forward-Looking Statements
This news release contains “forward-looking information” within the meaning of applicable Canadian securities laws and “forward-looking statements” within the meaning of the United States Private Securities Litigation Reform Act of 1995 (collectively, “forward-looking statements”). Forward-looking statements are made as of the date of this news release and relate to future events or performance. Often, but not always, forward-looking statements can be identified by words such as “expects,” “anticipates,” “plans,” “projects,” “estimates,” “envisages,” “assumes,” “intends,” “strategy,” “goals,” “objectives,” or variations (including negative variations) of such words and phrases, or statements that certain actions, events or results “may,” “could,” “would,” “might,” or “will” be taken, occur or be achieved.
Forward-looking statements in this news release include, without limitation, statements with respect to: (i) estimates of the tonnage and grades of Mineral Resources and Mineral Reserves; (ii) the potential amount of CO₂ removal per ton of rock and the development, verification, issuance and sale of carbon-removal credits; (iii) the PFS representing a viable development option for the Project and the timing of related disclosures; (iv) estimates of initial and sustaining capital costs, operating and total costs, payback periods, net cash flow, net present value and economic returns; (v) future production volumes (produced and sold), near-term sales volumes, sales assumptions and the expected effects of restructuring initiatives; (vi) the Company’s competitive position in Brazil and potash market demand; (vii) recommendations of any special committee; (viii) the terms, timing, court approval and financial impact of any debt restructuring; and (ix) the potential outcomes of re-assaying certain core samples.
These forward-looking statements are based on the Company’s and its consultants’ reasonable assumptions, estimates and opinions as of the date hereof, including, without limitation: (i) the presence and continuity of Mineral Resources and Mineral Reserves at estimated grades; (ii) geotechnical, hydrological and metallurgical characteristics of rock consistent with sampled results; (iii) capacities, availability and performance of equipment and personnel at estimated costs and timelines; (iv) foreign exchange rates; (v) realized sales prices, market size and adoption for the Company’s products; (vi) applicable discount, tax and royalty rates; (vii) availability and cost of acceptable financing; (viii) anticipated mining loss and dilution; (ix) receipt of required permits and other regulatory approvals on acceptable terms; (x) reasonable contingency allowances; (xi) successful execution of operating plans; (xii) the fulfilment of environmental assessment commitments and community arrangements; and (xiii) for carbon-removal activities, the applicability of methodologies, verification, permanence, monitoring and market acceptance.
Forward-looking statements are inherently subject to known and unknown risks, uncertainties and other factors that may cause actual results to differ materially from those expressed or implied. Such risks and uncertainties include, without limitation: risks related to court approvals and the completion of any debt restructuring; variations in grade or recovery; adverse geotechnical, hydrological or metallurgical conditions; changes in project parameters as plans continue to be refined; cost escalation and inflationary pressures; labour availability; fluctuations in commodity prices and demand (including potash); foreign-exchange volatility (including Brazilian Real–Canadian dollar); availability and terms of financing; changes in agricultural credit conditions, customer insolvencies and collection risk; the Company’s ability to implement restructuring measures and realize expected cost savings; changes in tax and royalty regimes; delays in permitting or stakeholder agreements; competitive pressures; infrastructure and operational risks; regulatory changes affecting mining, fertilizers and carbon-removal markets; and, for carbon-removal activities, risks relating to methodology eligibility, additionality, durability/permanence, leakage, monitoring, verification, certification, policy shifts and pricing, any of which could affect the issuance, saleability or value of credits. Additional information about risk factors is described in the Company’s most recent Annual Information Form filed on SEDAR+ (www.sedarplus.ca) and in other continuous disclosure filings. The foregoing list is not exhaustive, and there can be no assurance that forward-looking statements will prove accurate.
Readers are cautioned not to place undue reliance on forward-looking statements. Except as required by applicable law, the Company disclaims any intention or obligation to update or revise any forward-looking statements, whether as a result of new information, future events or otherwise.
Financial Outlook / Future-Oriented Financial Information
This news release may contain future-oriented financial information or financial outlooks (collectively, “FOFI”) within the meaning of applicable securities laws, including, without limitation, management’s expectations regarding near-term sales volumes, the effects of restructuring initiatives, liquidity preservation and, where applicable, estimates of capital and operating costs, net present value, internal rate of return, payback and projected revenues or cash flows. Such FOFI is provided to describe management’s current expectations regarding the Company’s business, market conditions and proposed project development and may not be appropriate for other purposes. The FOFI is based on the assumptions and subject to the risks described above, and actual results may vary materially.
Currency, Units and Trademarks
Unless otherwise stated, all figures are in Canadian dollars (C$). Tonnages are metric tons.
Consolidated Statement Of Profit or Loss(1)
For the year ended 31 December 2025
All amounts expressed in Canadian Dollars.
|
2025
$’000 |
2024
$’000 |
| Revenue |
16,605 |
21,597 |
| Cost of sales |
(7,703) |
(9,350) |
| Gross Profit |
8,902 |
12,247 |
| |
|
|
| Sales and distribution expenses |
(9,642) |
(11,391) |
| Administrative expenses |
(6,052) |
(8,748) |
| Operating (Loss) |
(6,792) |
(7,892) |
|
|
|
| Finance costs |
(5,197) |
(5,108) |
| Finance income |
339 |
473 |
| (Loss) before tax from continuing operations |
(11,650) |
(12,527) |
|
|
|
| Income tax expense |
(20) |
(31) |
| (Loss) /for the year |
(11,670) |
(12,558) |
| Earnings per share ($) |
2025 |
2024 |
| Basic (loss) / per share |
(0.221) |
(0.238) |
| Diluted (loss) / per share |
(0.221) |
(0.238) |
(1) For important notes and disclosures, please refer to the Company’s Q4& FY full consolidated financial statements and accompanying notes.
Consolidated statement of financial position(1)
As at 31 December 2025
All amounts expressed in Canadian Dollars.
|
Assets |
2025 |
2024 |
| ($’000) |
($’000) |
| Property, plant and equipment |
39,445 |
39,865 |
| Right-of-use asset |
– |
34 |
| Mineral properties |
18,374 |
17,290 |
| Other assets |
396 |
366 |
| Deferred tax asset |
2,595 |
2,413 |
| Total non-current assets |
60,810 |
59,968 |
| Inventory |
1,376 |
1,709 |
| Trade and other receivables |
5,311 |
6,864 |
| Other financial assets |
– |
– |
| Cash and cash equivalents |
2,985 |
3,476 |
| Total current assets |
9,672 |
12,049 |
| Total assets |
70,482 |
72,017 |
|
| Equity attributable to the equity holders of the parent |
| Issued capital |
20,664 |
20,652 |
| Capital contribution |
49,862 |
49,862 |
| Merger reserve |
(4,557) |
(4,557) |
| Translation reserve |
(14,924) |
(16,750) |
| Accumulated losses |
(30,262) |
(18,872) |
| Total equity |
20,783 |
30,335 |
| Liabilities |
| Interest-bearing loans and borrowings |
41,997 |
39,444 |
| Lease liabilities |
– |
24 |
| Provisions |
128 |
155 |
| Total non-current liabilities |
42,125 |
39,623 |
| Trade and other payables |
2,148 |
1,740 |
| Interest-bearing loans and borrowings |
5,421 |
265 |
| Lease liabilities |
– |
17 |
| Other financial liabilities |
5 |
37 |
| Total current liabilities |
7,574 |
2,059 |
| Total liabilities |
49,699 |
41,682 |
| Total equity and liabilities |
70,482 |
72,017 |
(1)For important notes and disclosures, please refer to the Company’s Q4 & FY full consolidated financial statements and accompanying notes.
